Why this study was needed
Rajbandh is an open, unlined landfill in Jalma Union near Khulna City. The site receives a major portion of the municipal solid waste generated by Khulna City Corporation, while the surrounding urban fringe is undergoing land-use change and depends on groundwater for domestic and other uses. Leachate migration therefore raises a practical question that short-term sampling alone cannot answer: where could contamination move over decades?
The challenge was also methodological. The site is data-scarce, monitoring wells are limited, and the subsurface is not a single homogeneous aquifer. The modeling framework therefore had to combine available field observations with a multilayer conceptualization while keeping the simulated transport assumptions explicit.
Research questions
The model was designed around a set of linked hydrogeologic questions rather than a software exercise:
- How does the chromium-affected area evolve over a multi-decadal simulation?
- How does the local groundwater-flow field control plume direction?
- How strongly does layer-wise hydraulic conductivity affect migration between clay and sand units?
- How long does the upper clay aquitard delay the selected chromium threshold from reaching the underlying sand aquifer?
- Can a calibrated MODFLOW–MT3DMS framework provide a defensible baseline for groundwater-risk assessment in a monitoring-limited setting?
Study area & data foundation
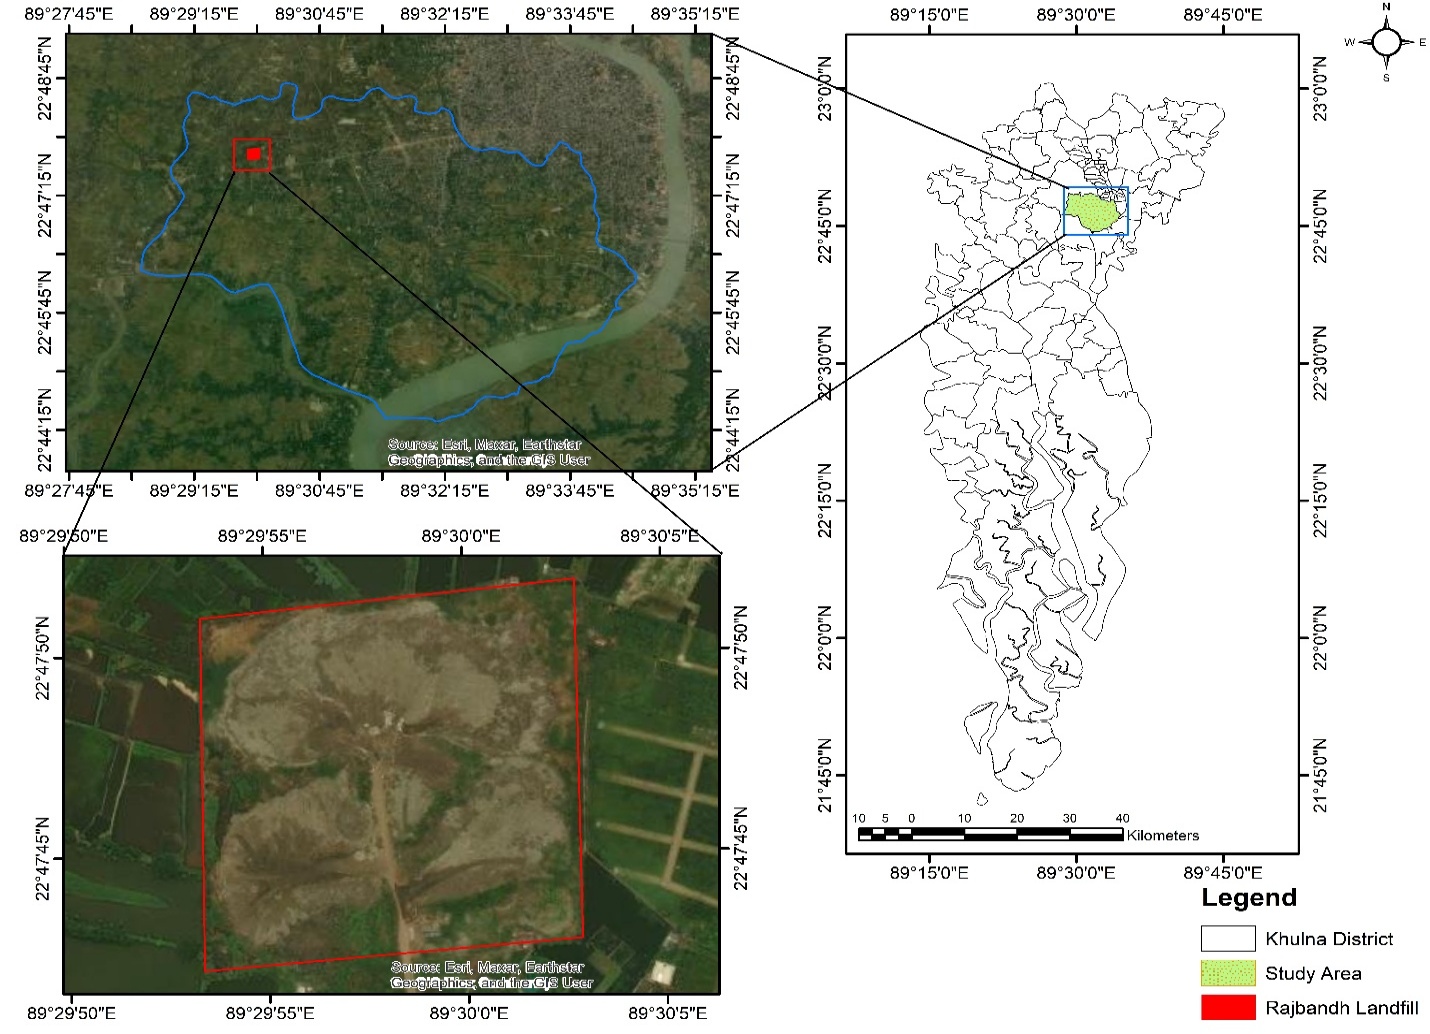
The Rajbandh landfill is located in Jalma Union, Batiaghata Upazila, immediately outside the southwest boundary of Khulna City Corporation. The landfill itself occupies approximately 0.074 km²; the broader modeling domain covers about 50.82 km².
Spatial and hydrogeologic inputs were assembled to define surface elevation, model boundaries, aquifer layering, hydraulic properties, recharge and groundwater-flow conditions. Field chromium measurements were subsequently used to calibrate and evaluate the transport simulation.
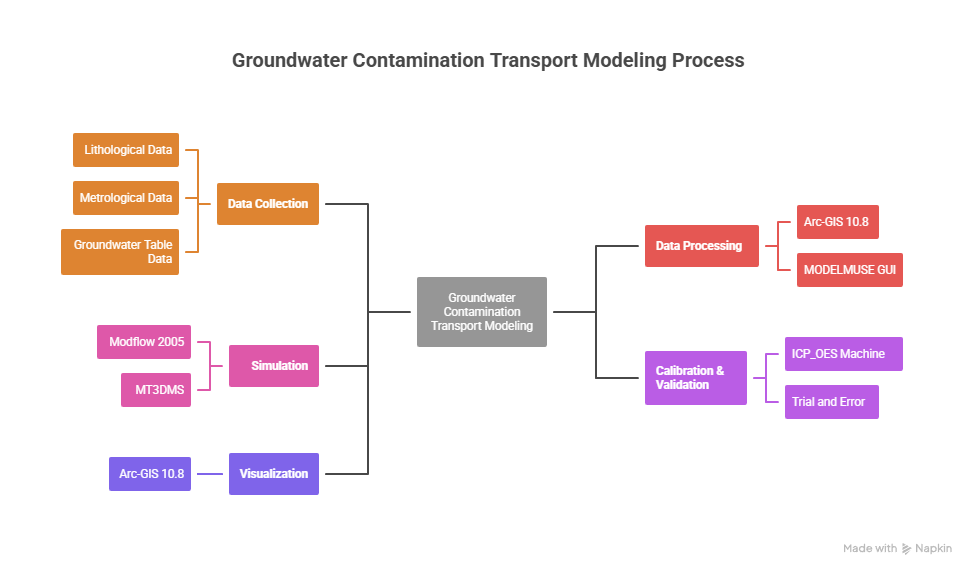
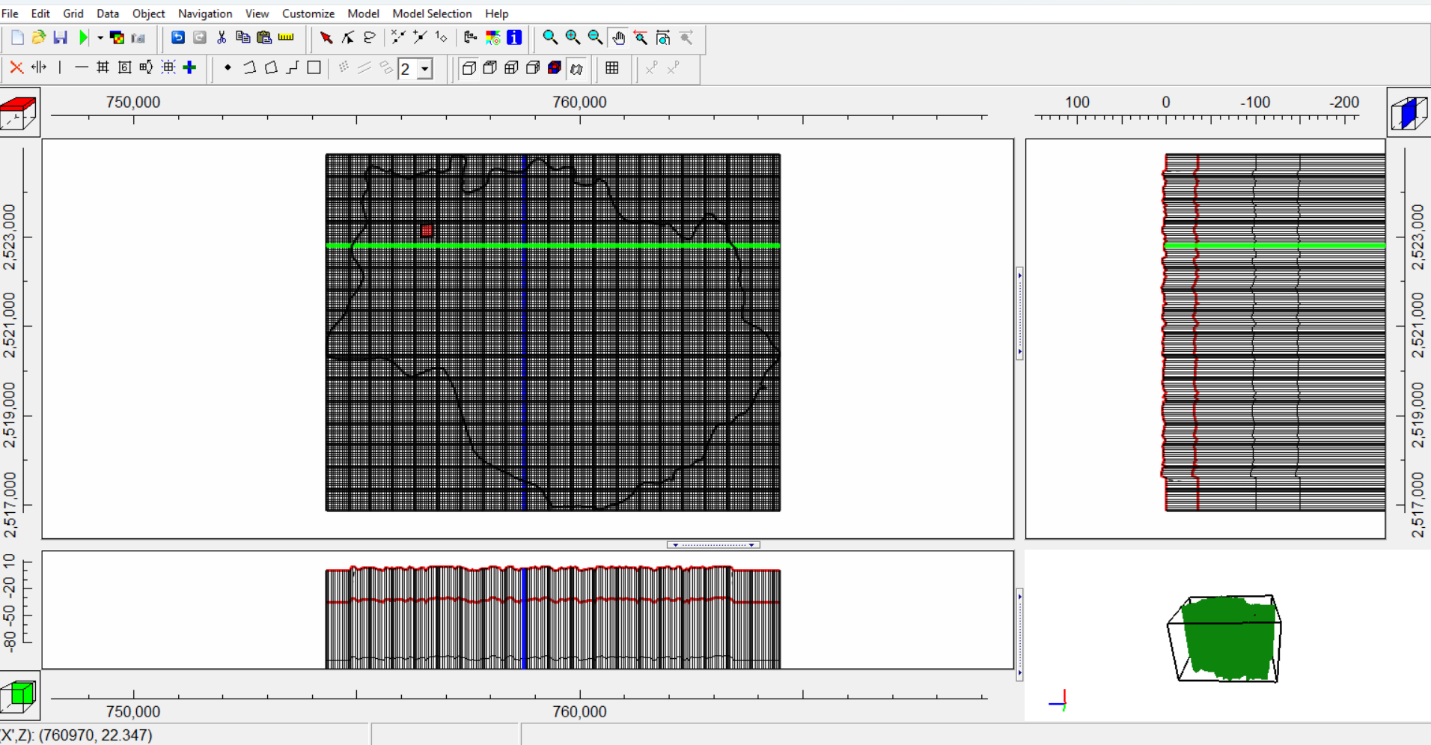
ArcGIS was used for spatial preparation and visualization, while ModelMuse provided the graphical environment for constructing the MODFLOW and MT3DMS models.
Representing a multilayer subsurface
A central modeling decision was to represent the site with layer-specific hydraulic properties, rather than applying one uniform conductivity to the entire subsurface. The conceptual model contains two sandy aquifers separated and bounded by lower-permeability aquitards.
| Layer | Depth (m) | Hydraulic conductivity (m/d) | Specific storage (1/m) | Specific yield |
|---|---|---|---|---|
| Upper clay aquitard | 1–35 | 0.91 | 4.94×10⁻⁴ | 0.0927 |
| 1st aquifer | 35–100 | 7.35 | 1.35×10⁻⁴ | 0.14 |
| Middle silty aquitard | 100–150 | 1.25 | 2.30×10⁻⁴ | 0.12 |
| 2nd aquifer | 150–270 | 5.00 | 2.12×10⁻⁴ | 0.1238 |
| Bottom clay aquitard | 270–325 | 0.42 | 7.98×10⁻⁴ | 0.0586 |
Coupled numerical modeling framework
The study separated the problem into groundwater flow and solute transport. MODFLOW-2005 simulated groundwater flow from 2010 to 2050, and MT3DMS simulated chromium transport from 2017 to 2050. ModelMuse was used to construct and manage the finite-difference model, and ArcGIS was used for spatial outputs and contamination mapping.
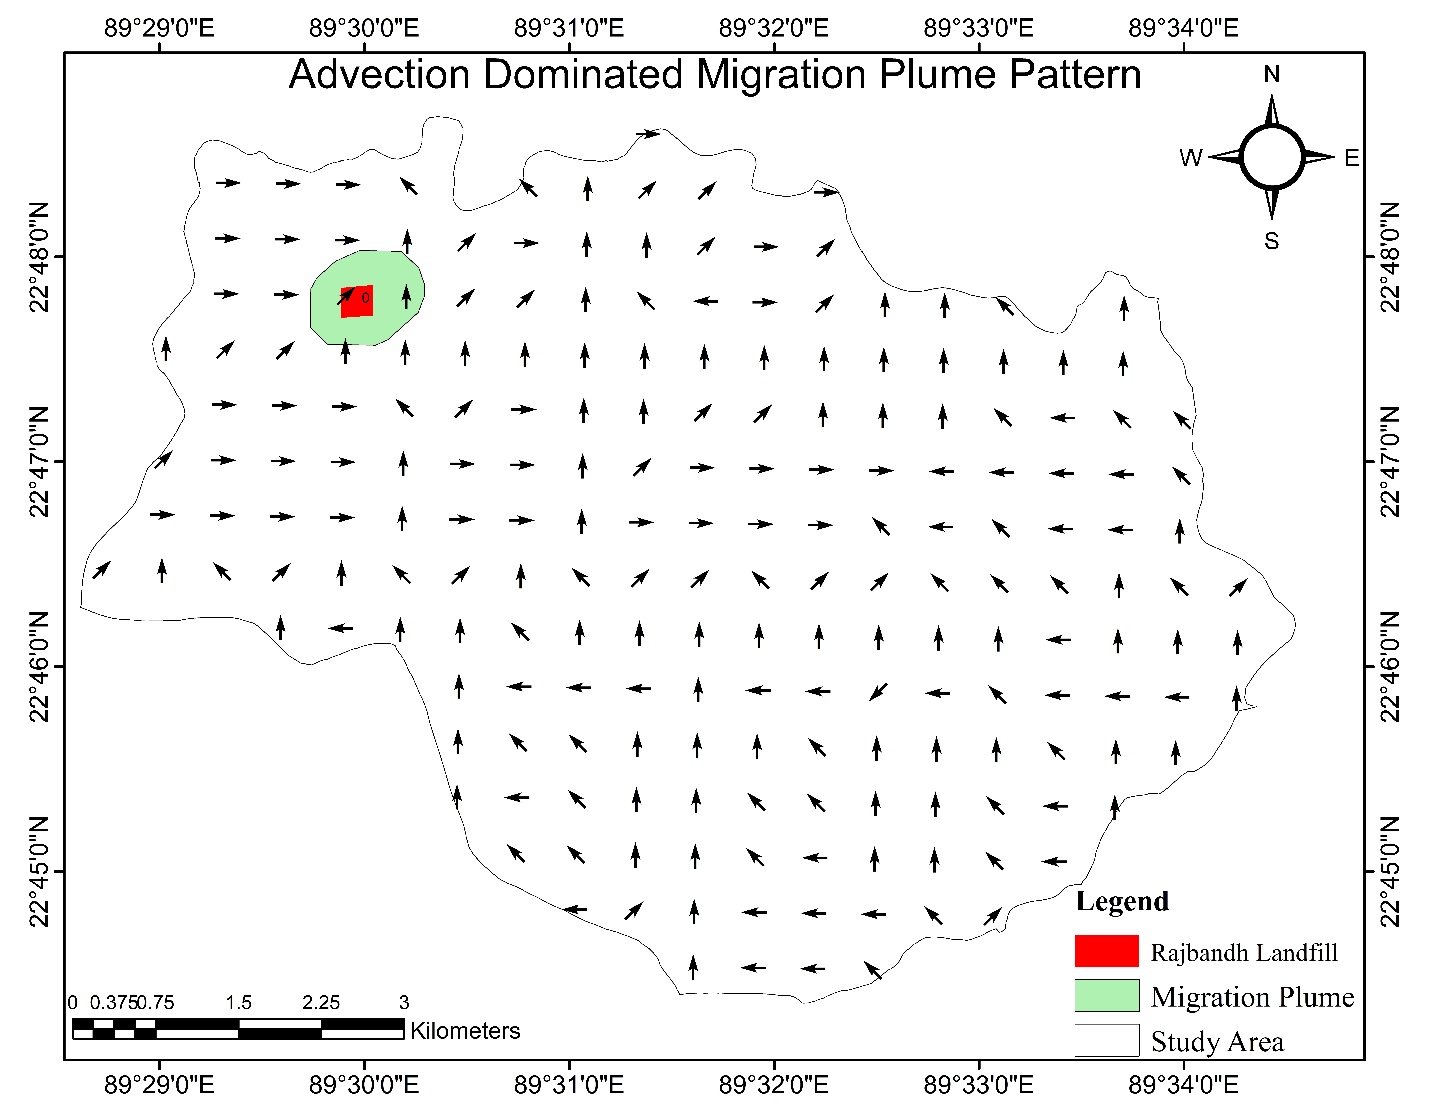
The transport simulation used a deliberately conservative formulation focused on advection and hydrodynamic dispersion. Geochemical reactions, sorption and other reactive processes were not represented in the published transport model. This keeps the physical assumptions transparent and avoids attributing simulated retardation to chemistry that was not modeled.
Calibration against observed chromium
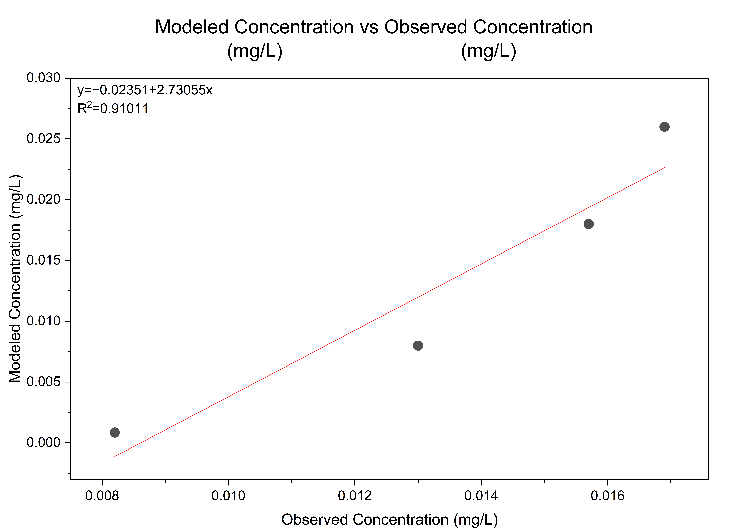
The transport model was first run through 2025 and calibrated against observed chromium concentrations. Longitudinal dispersivity was adjusted during calibration, after which the full transport simulation was extended through 2050.
The thesis development file contains a slightly different preliminary regression value; this portfolio uses the final published article as the authoritative value.
Groundwater flow establishes the transport pathway
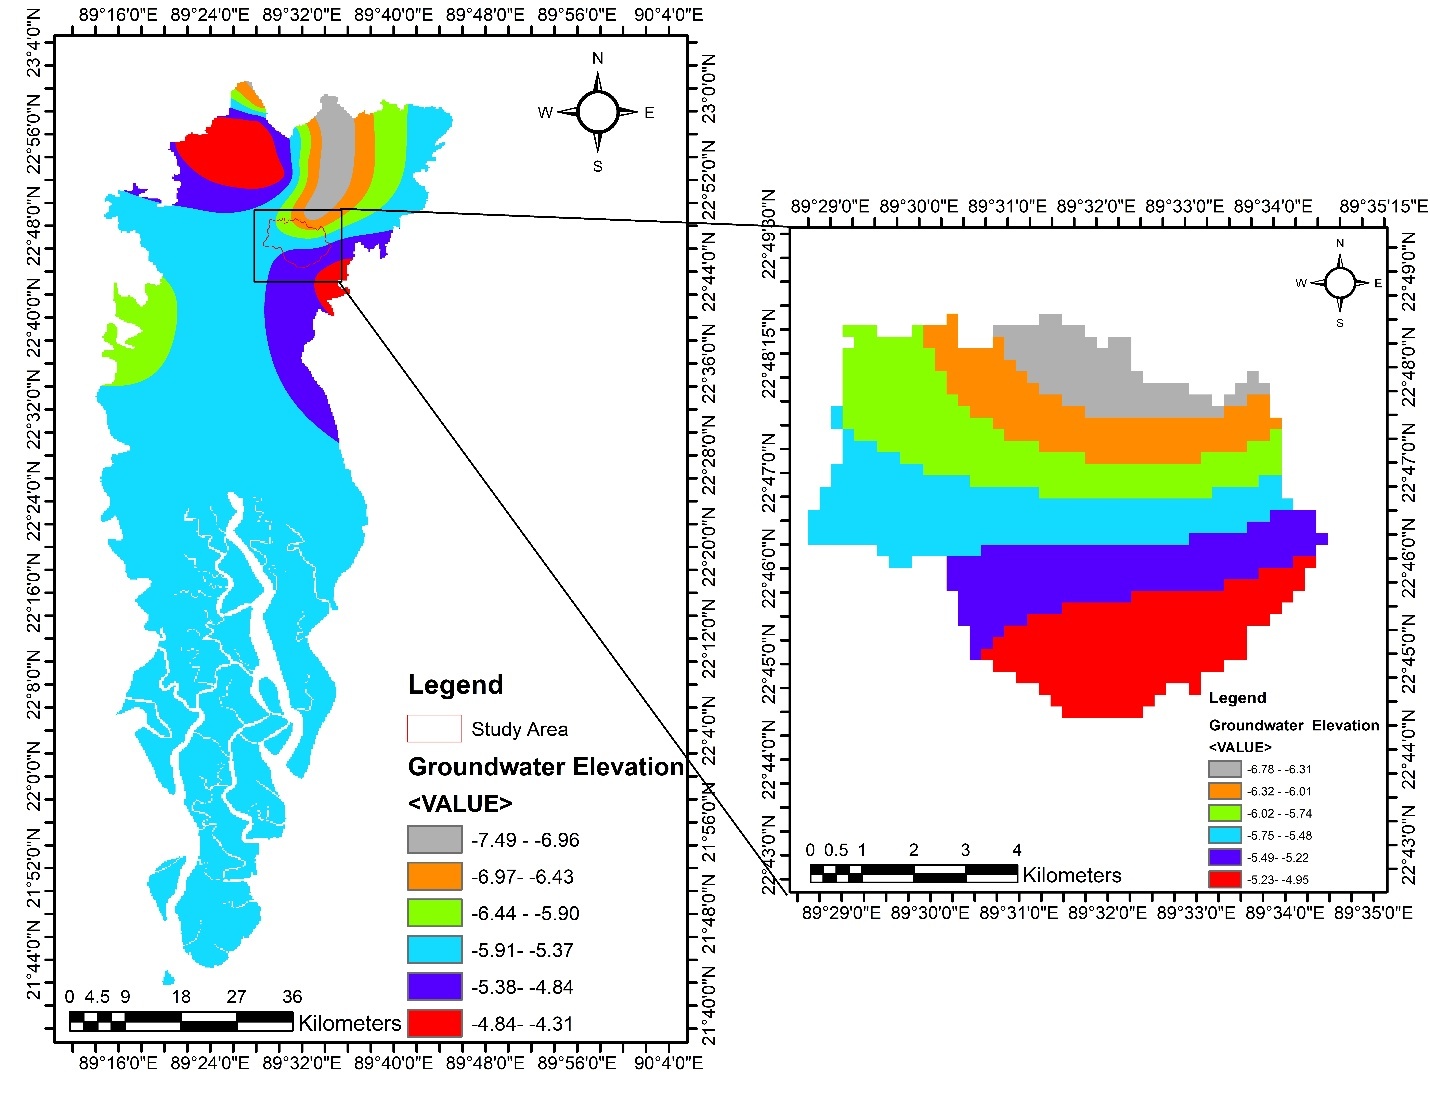
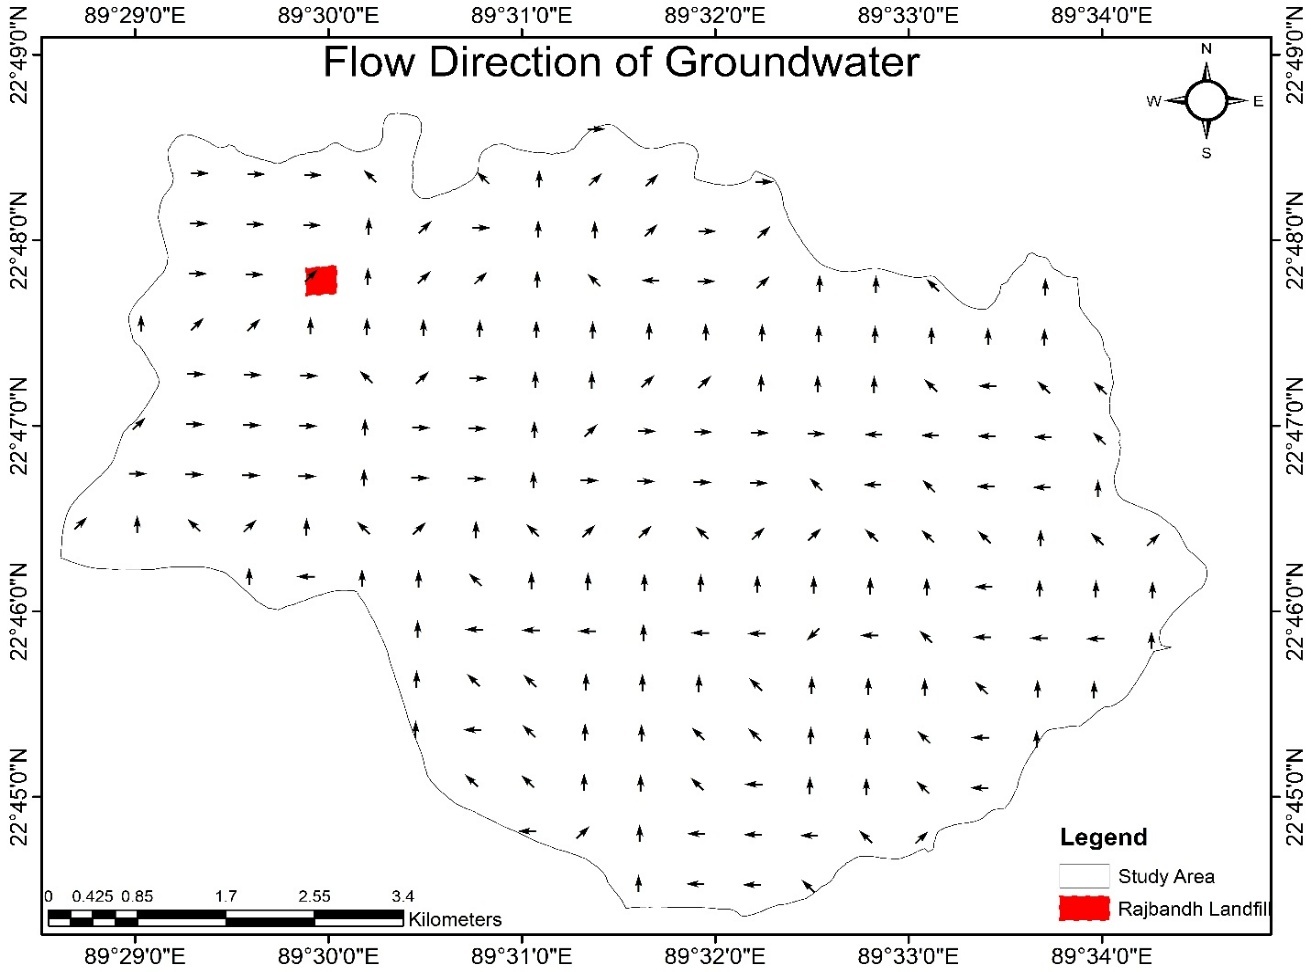
The published results describe a local groundwater-flow direction from south to north. The study links this localized pattern to groundwater abstraction in the direction of Khulna City, which lowers hydraulic head in the northern part of the model domain.
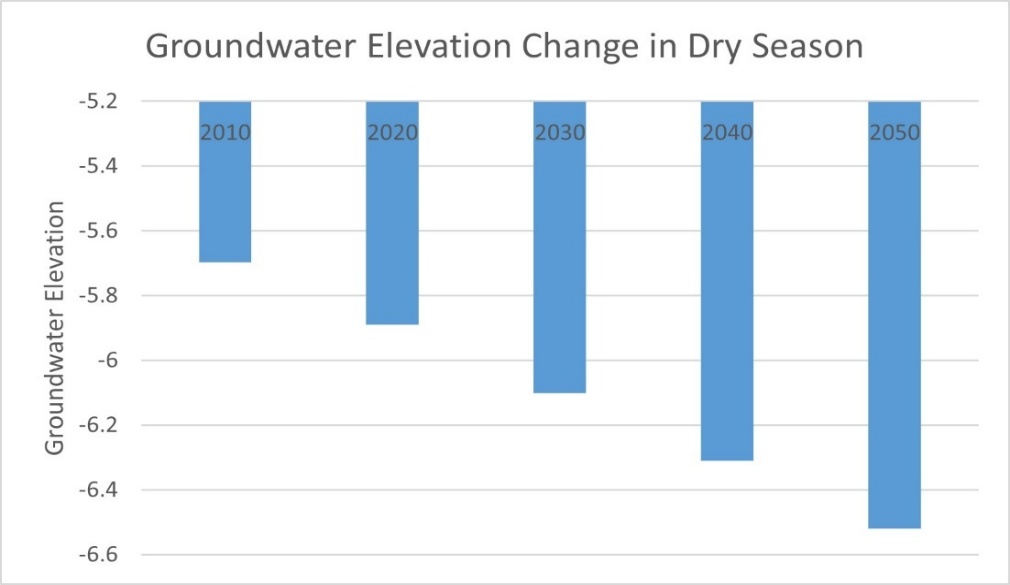
The flow simulation also projects a progressive decline in average dry-season groundwater level over the 2010–2050 period, adding a dynamic hydraulic context for the transport analysis.
Thirty-three years of plume evolution
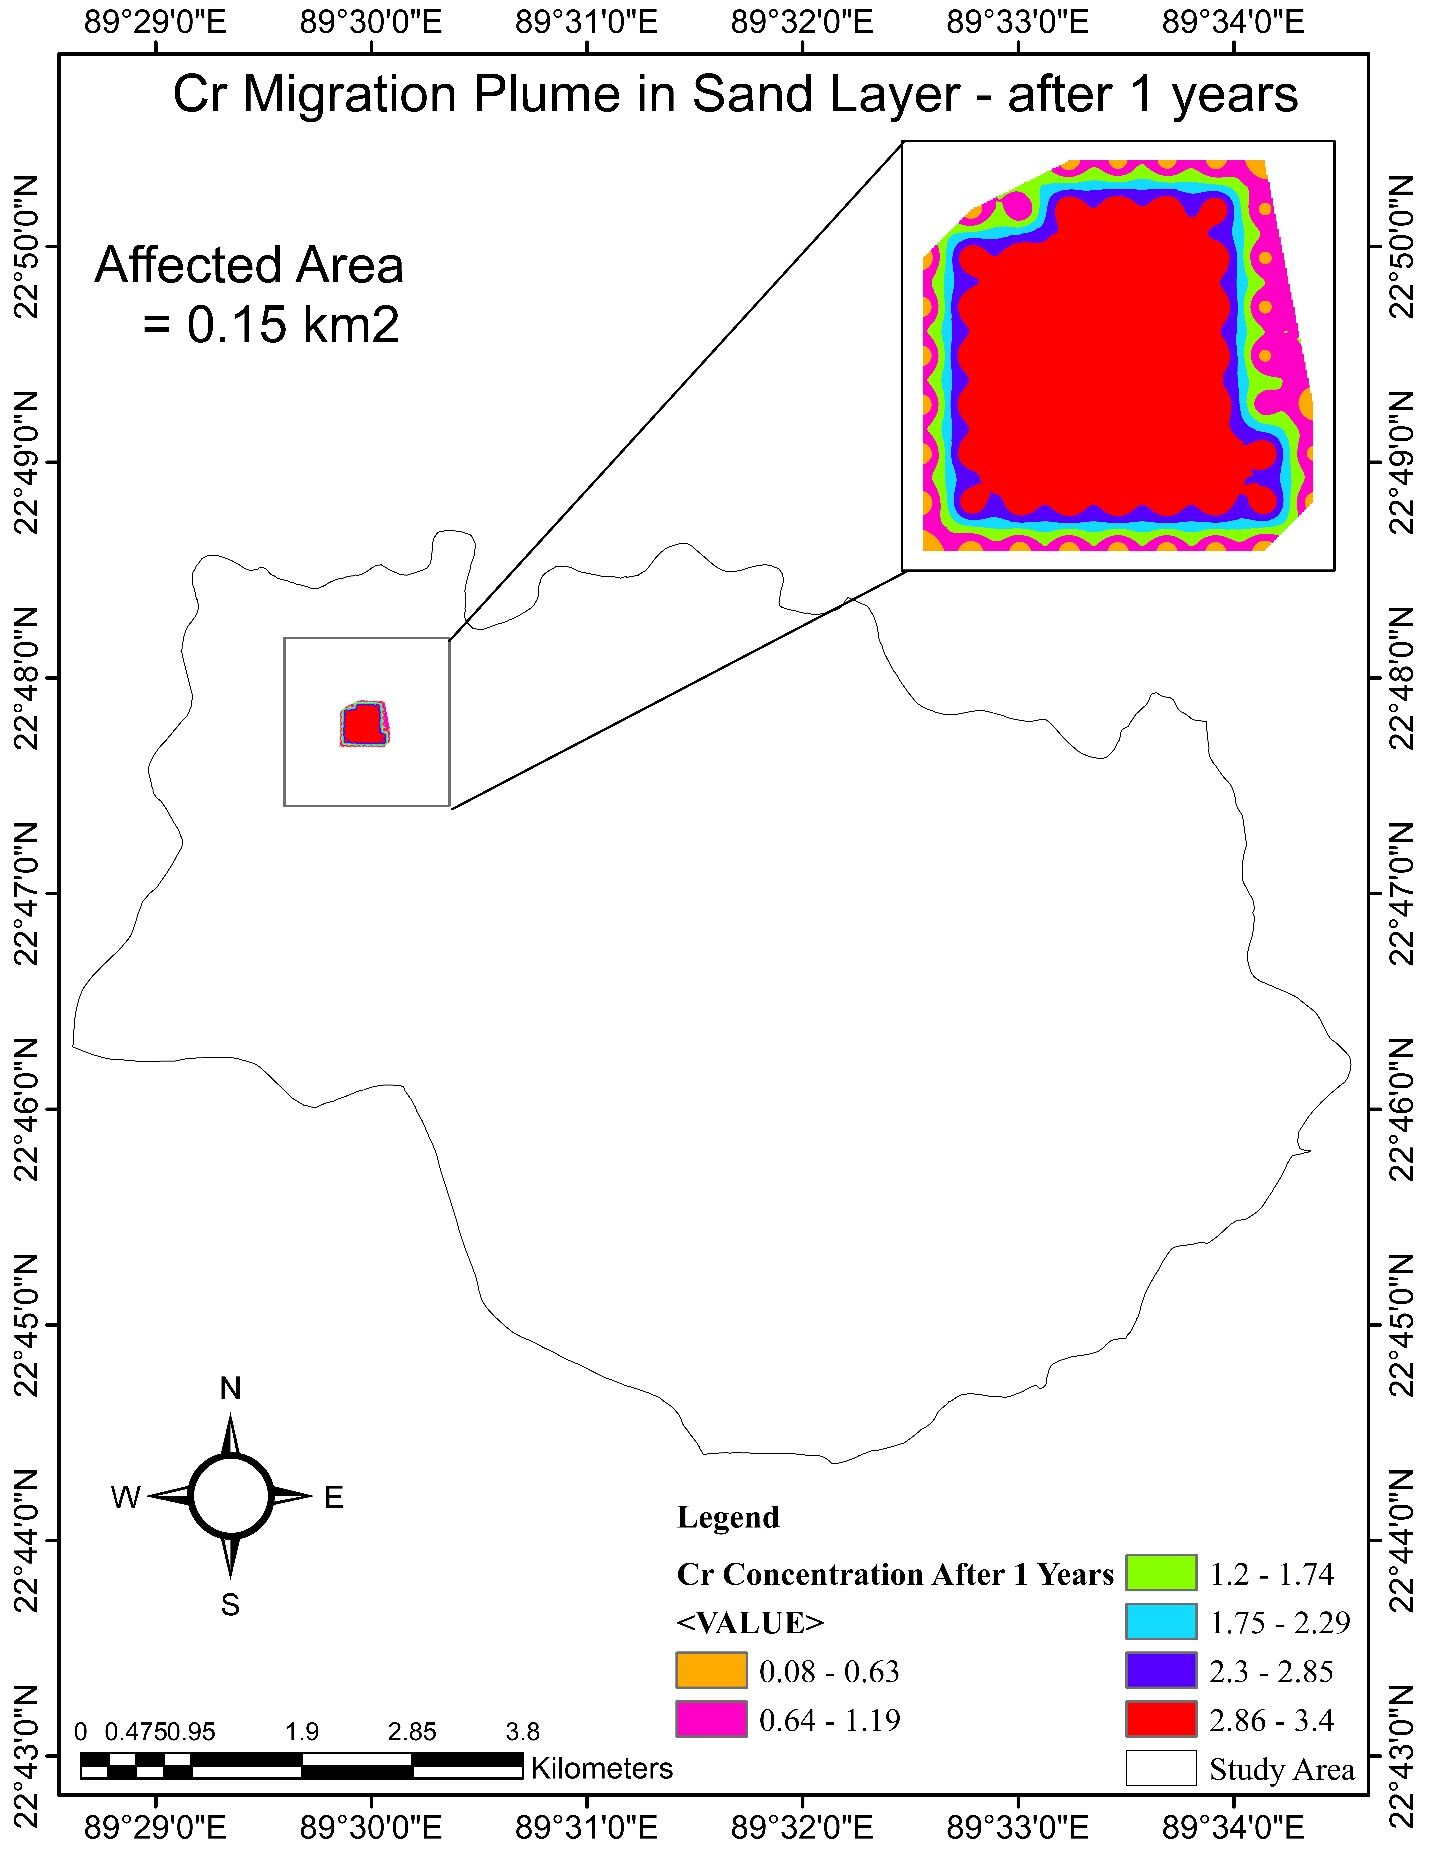
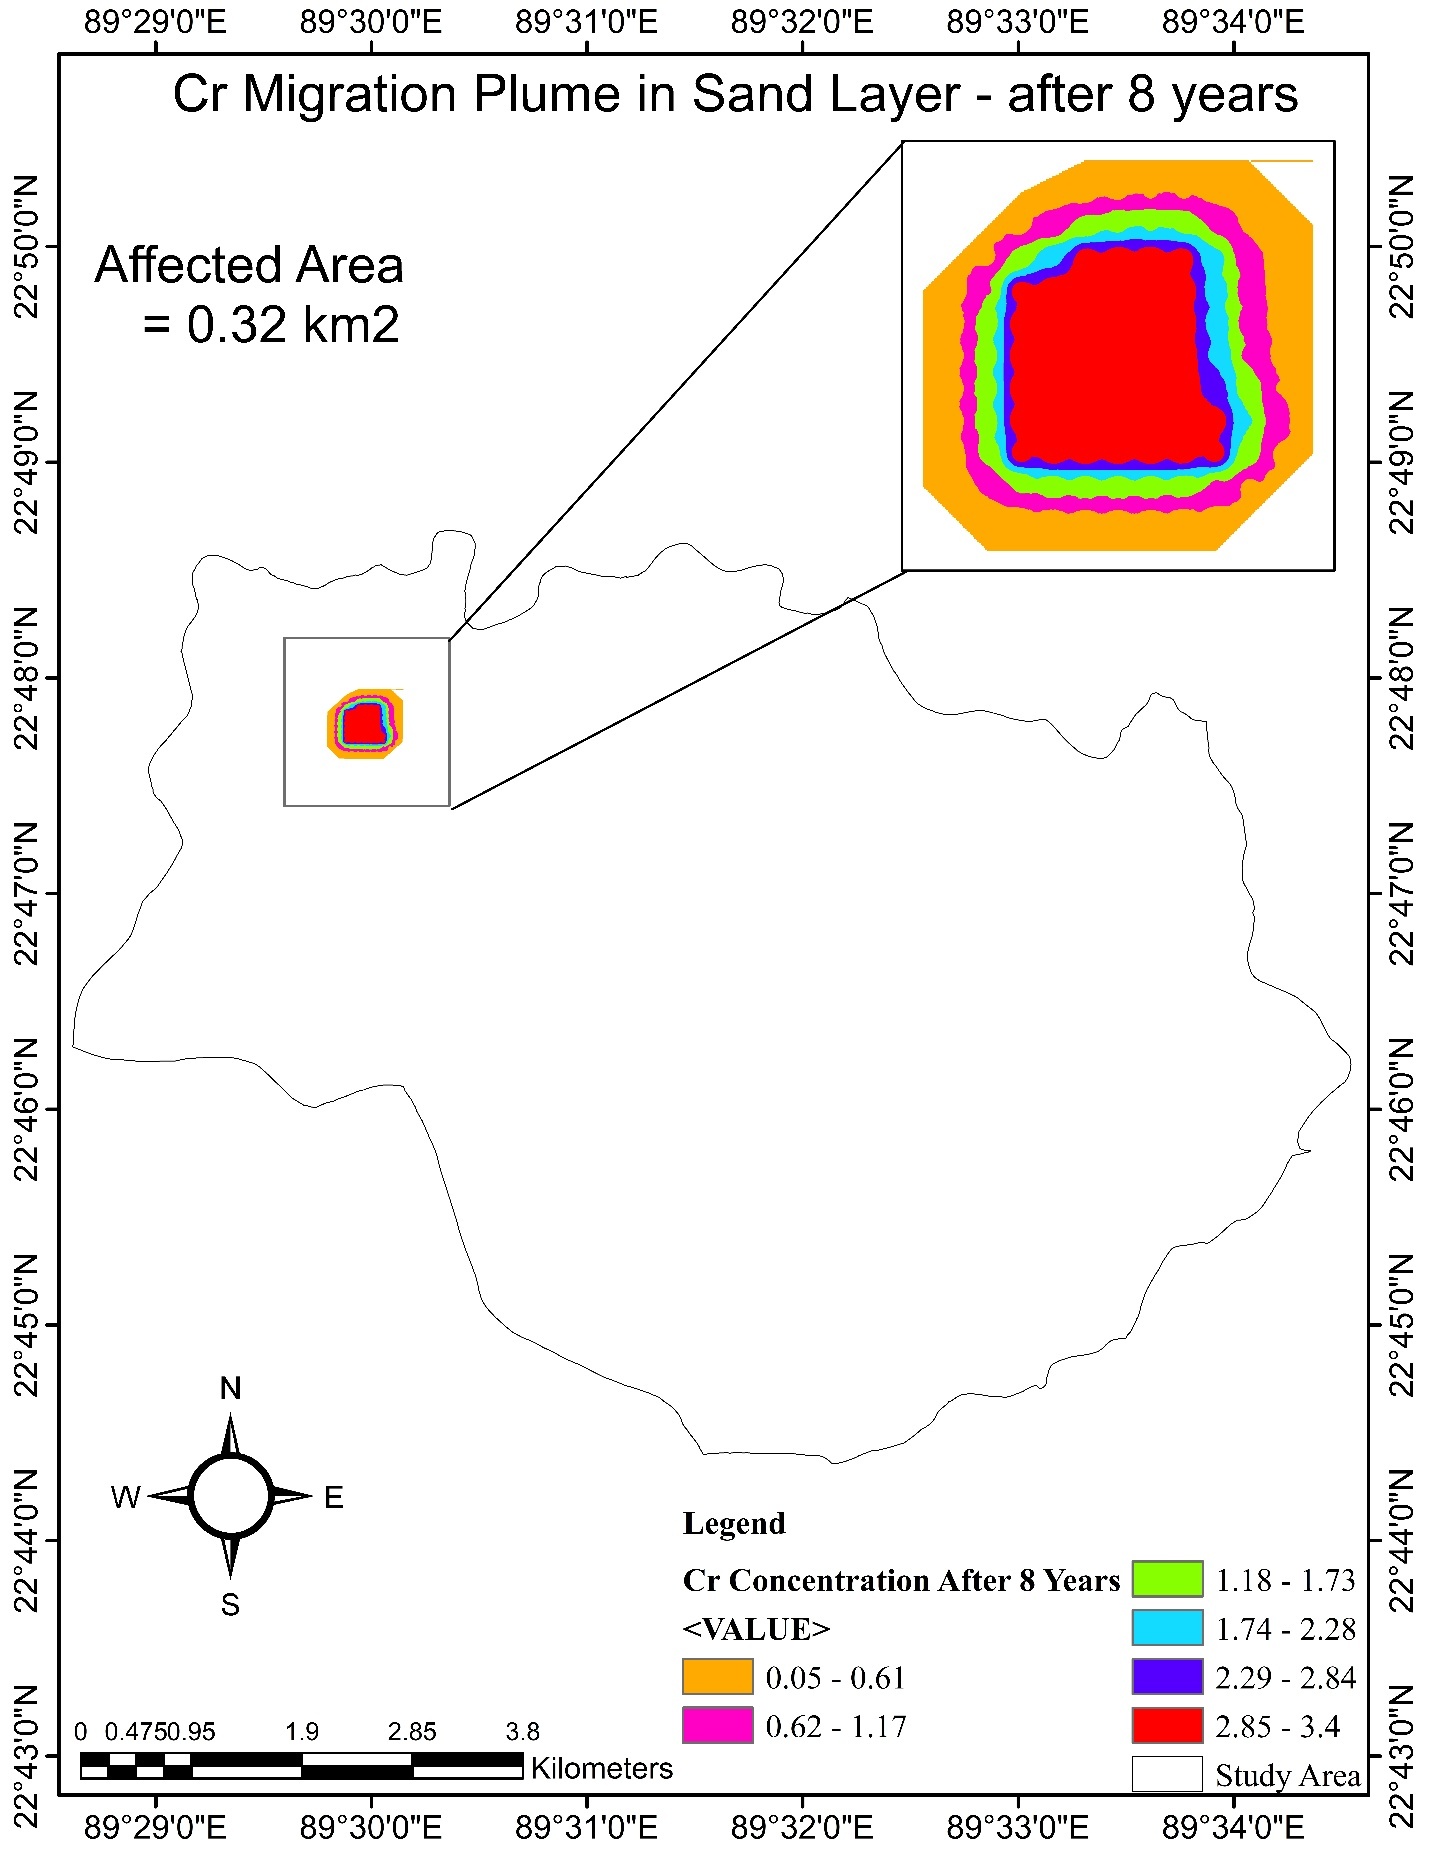
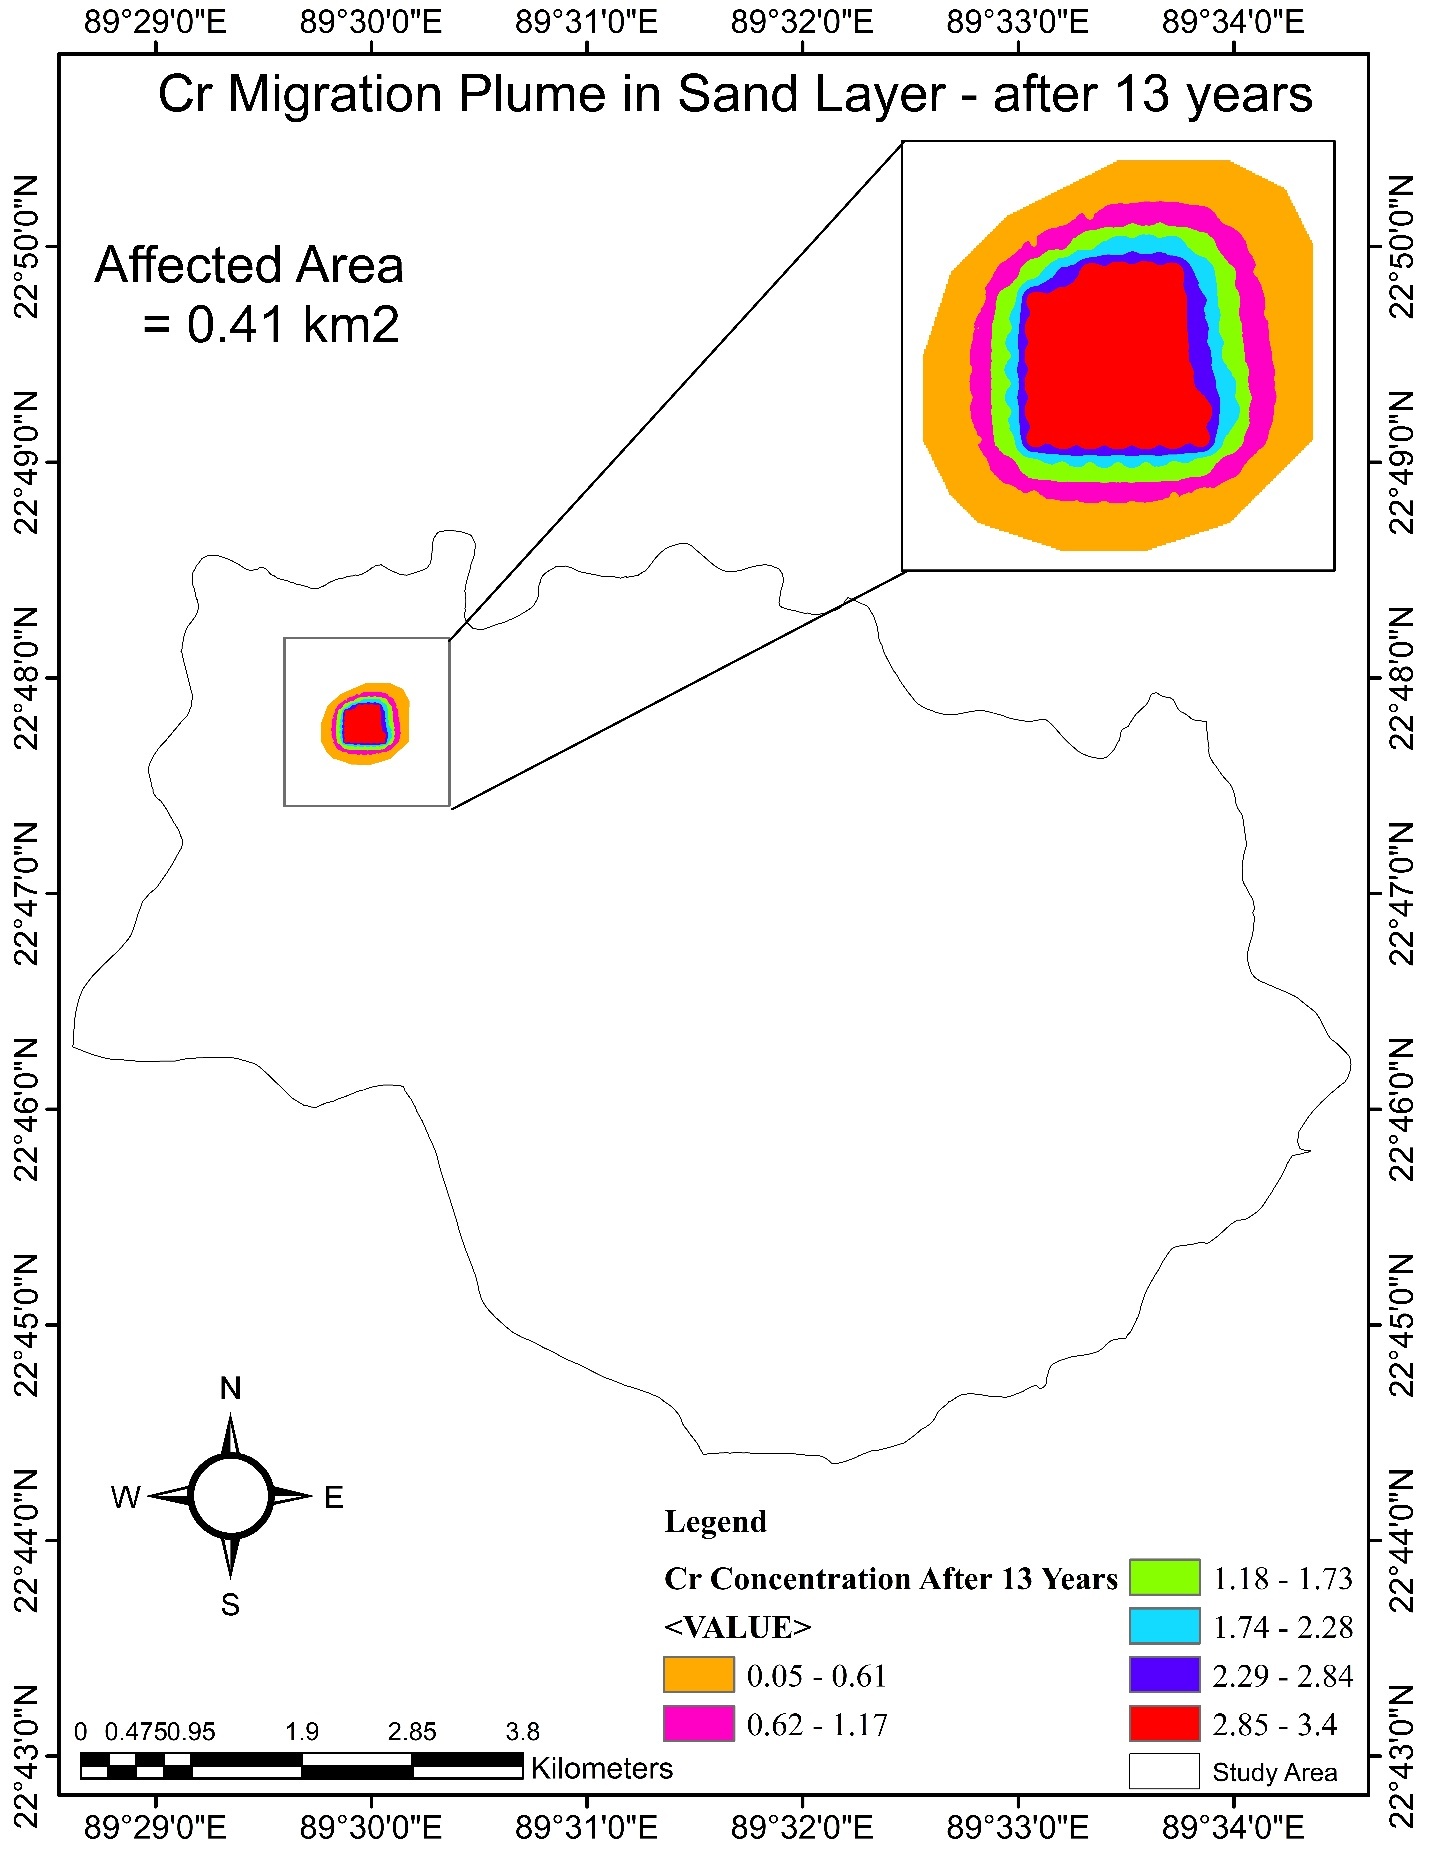
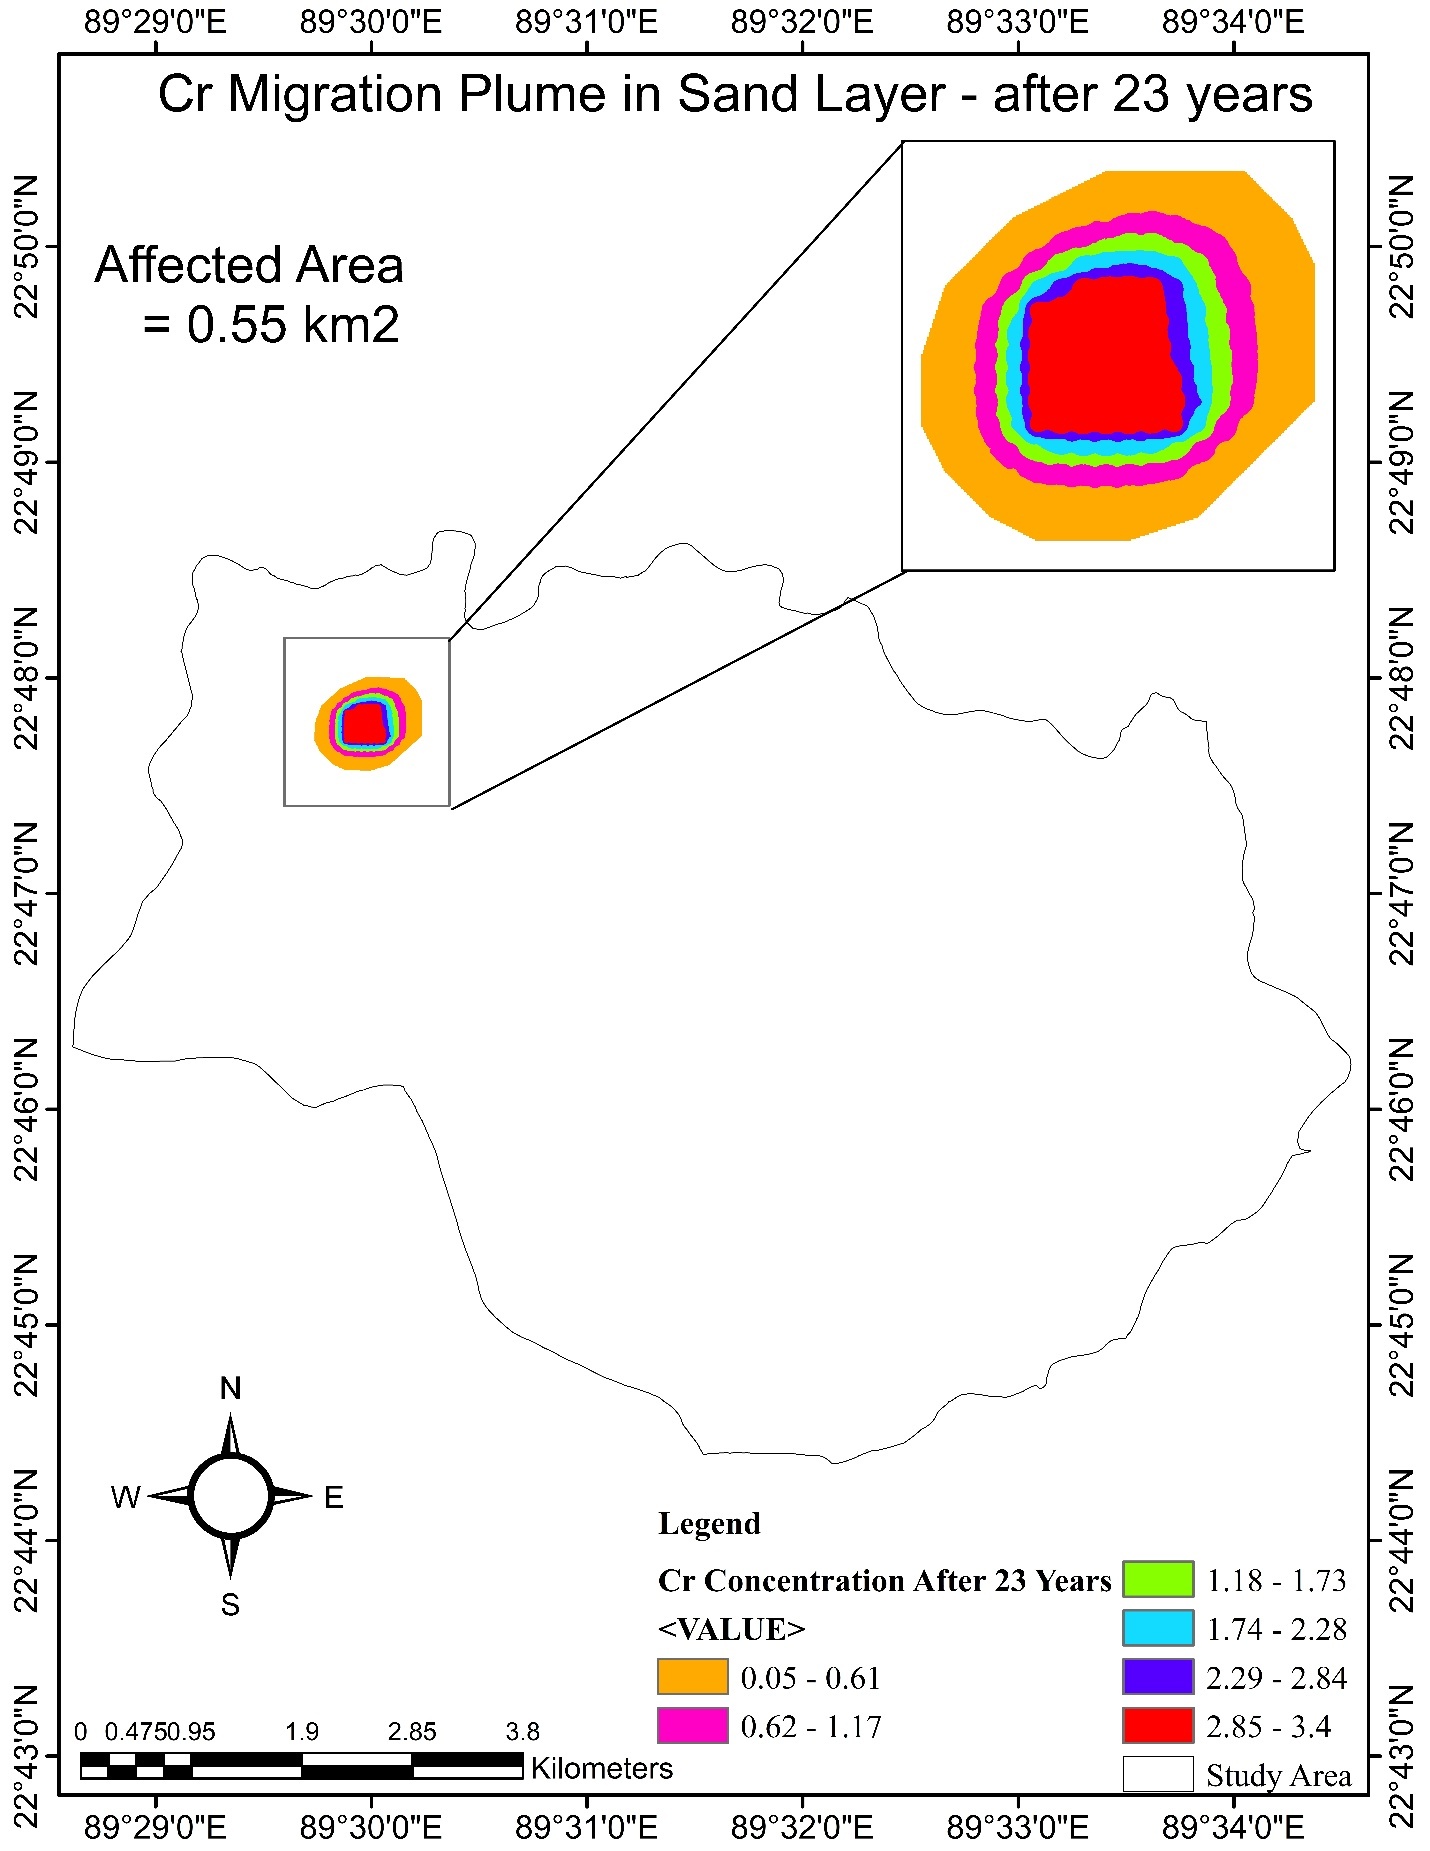
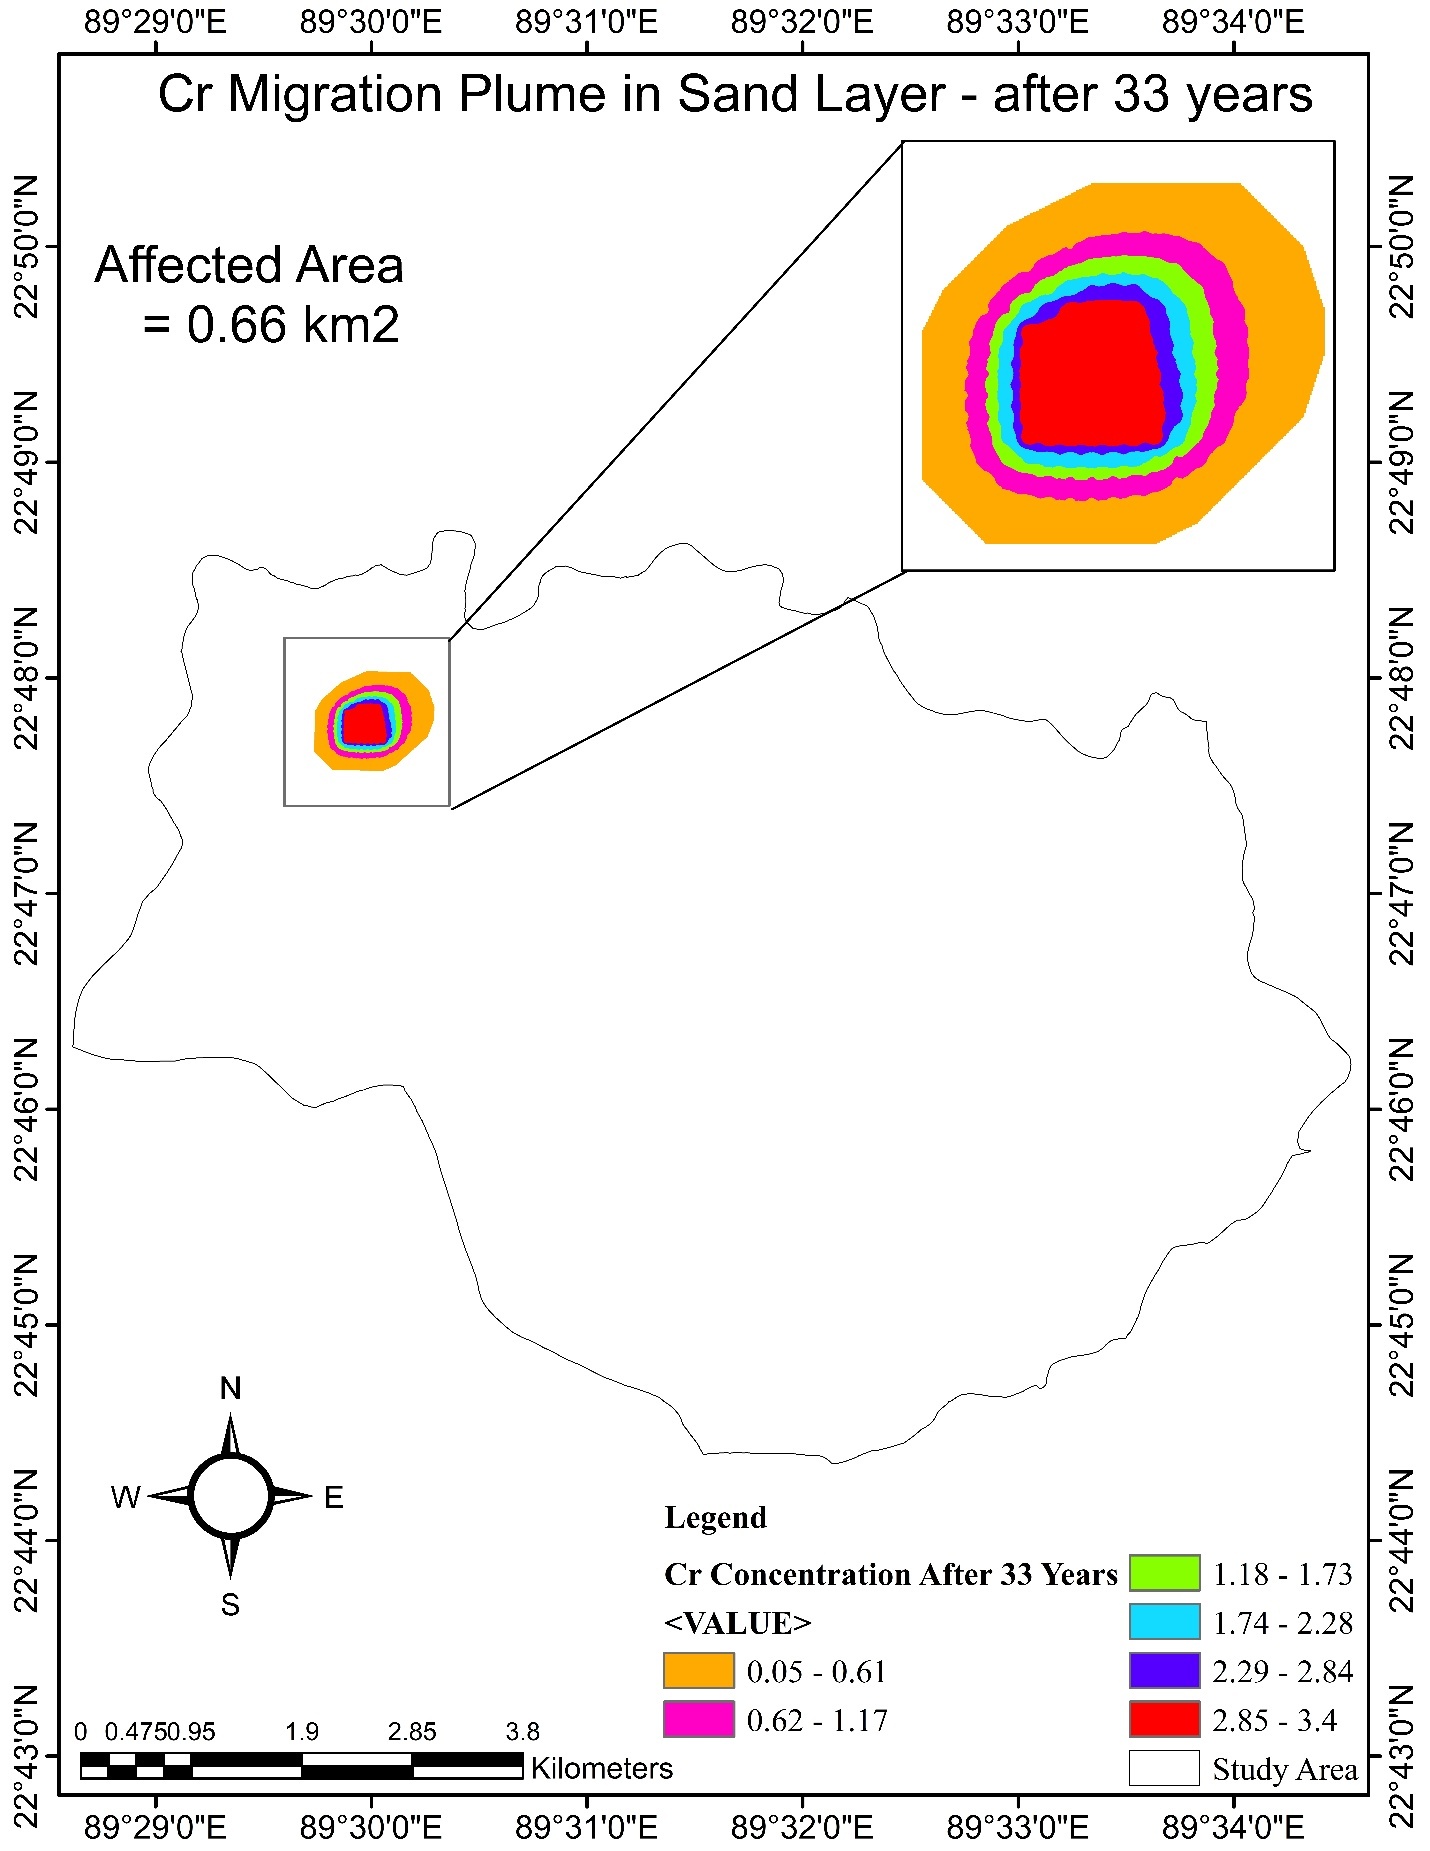
The most direct long-term result is the expansion of the sand-aquifer area above the selected chromium threshold. The affected footprint increases from 0.15 km² after one year to 0.66 km² after 33 years.
The plume is elongated along the groundwater-flow path, consistent with an advection-dominated transport regime. Dispersion contributes longitudinal and transverse spreading, while advective groundwater movement controls the principal direction of migration.
Hydraulic conductivity controls the contrast between clay and sand
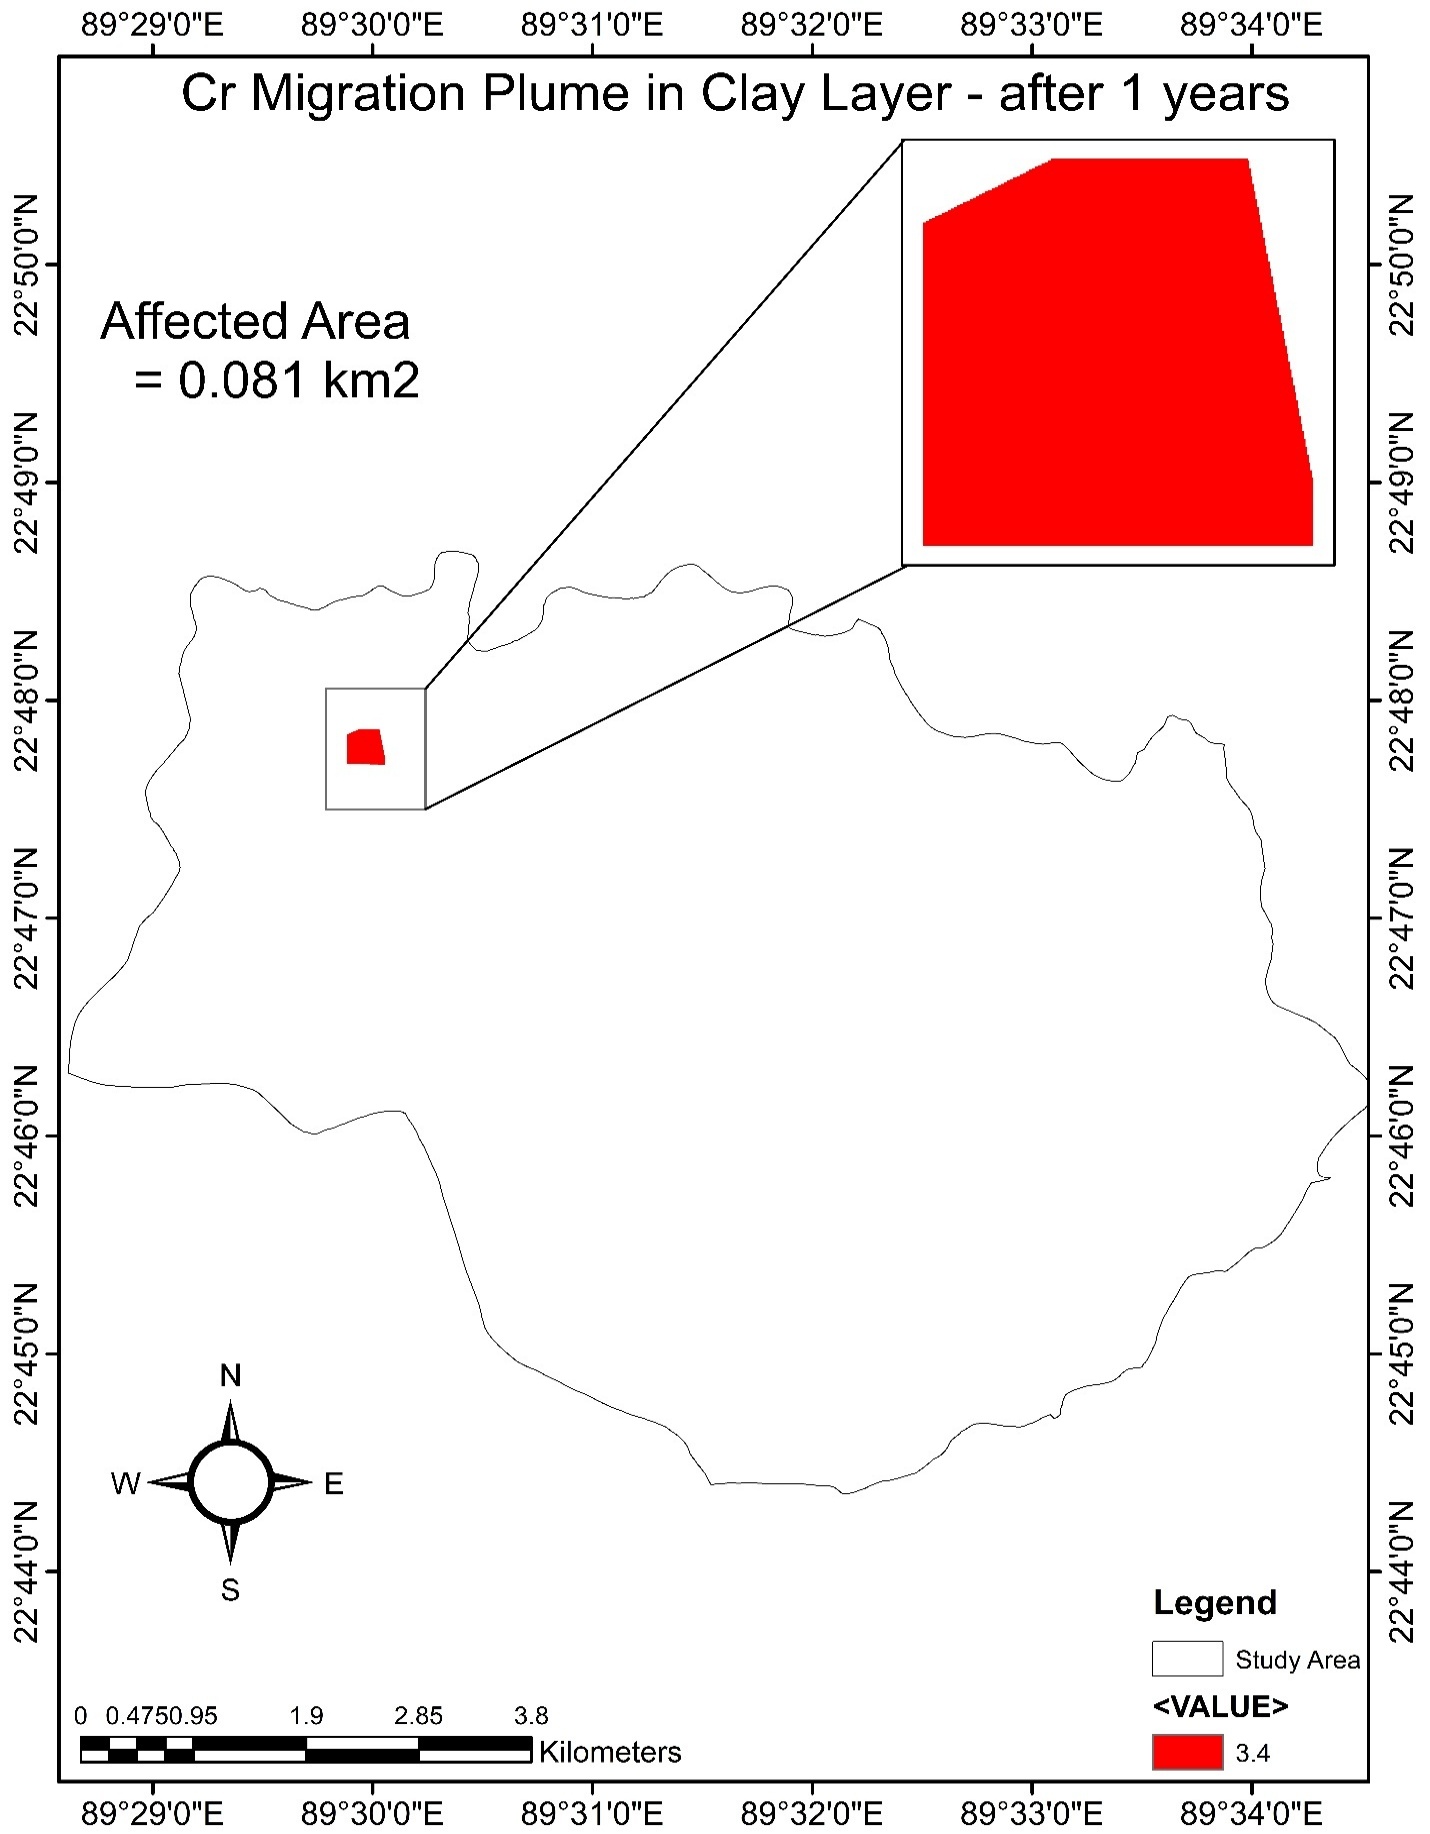
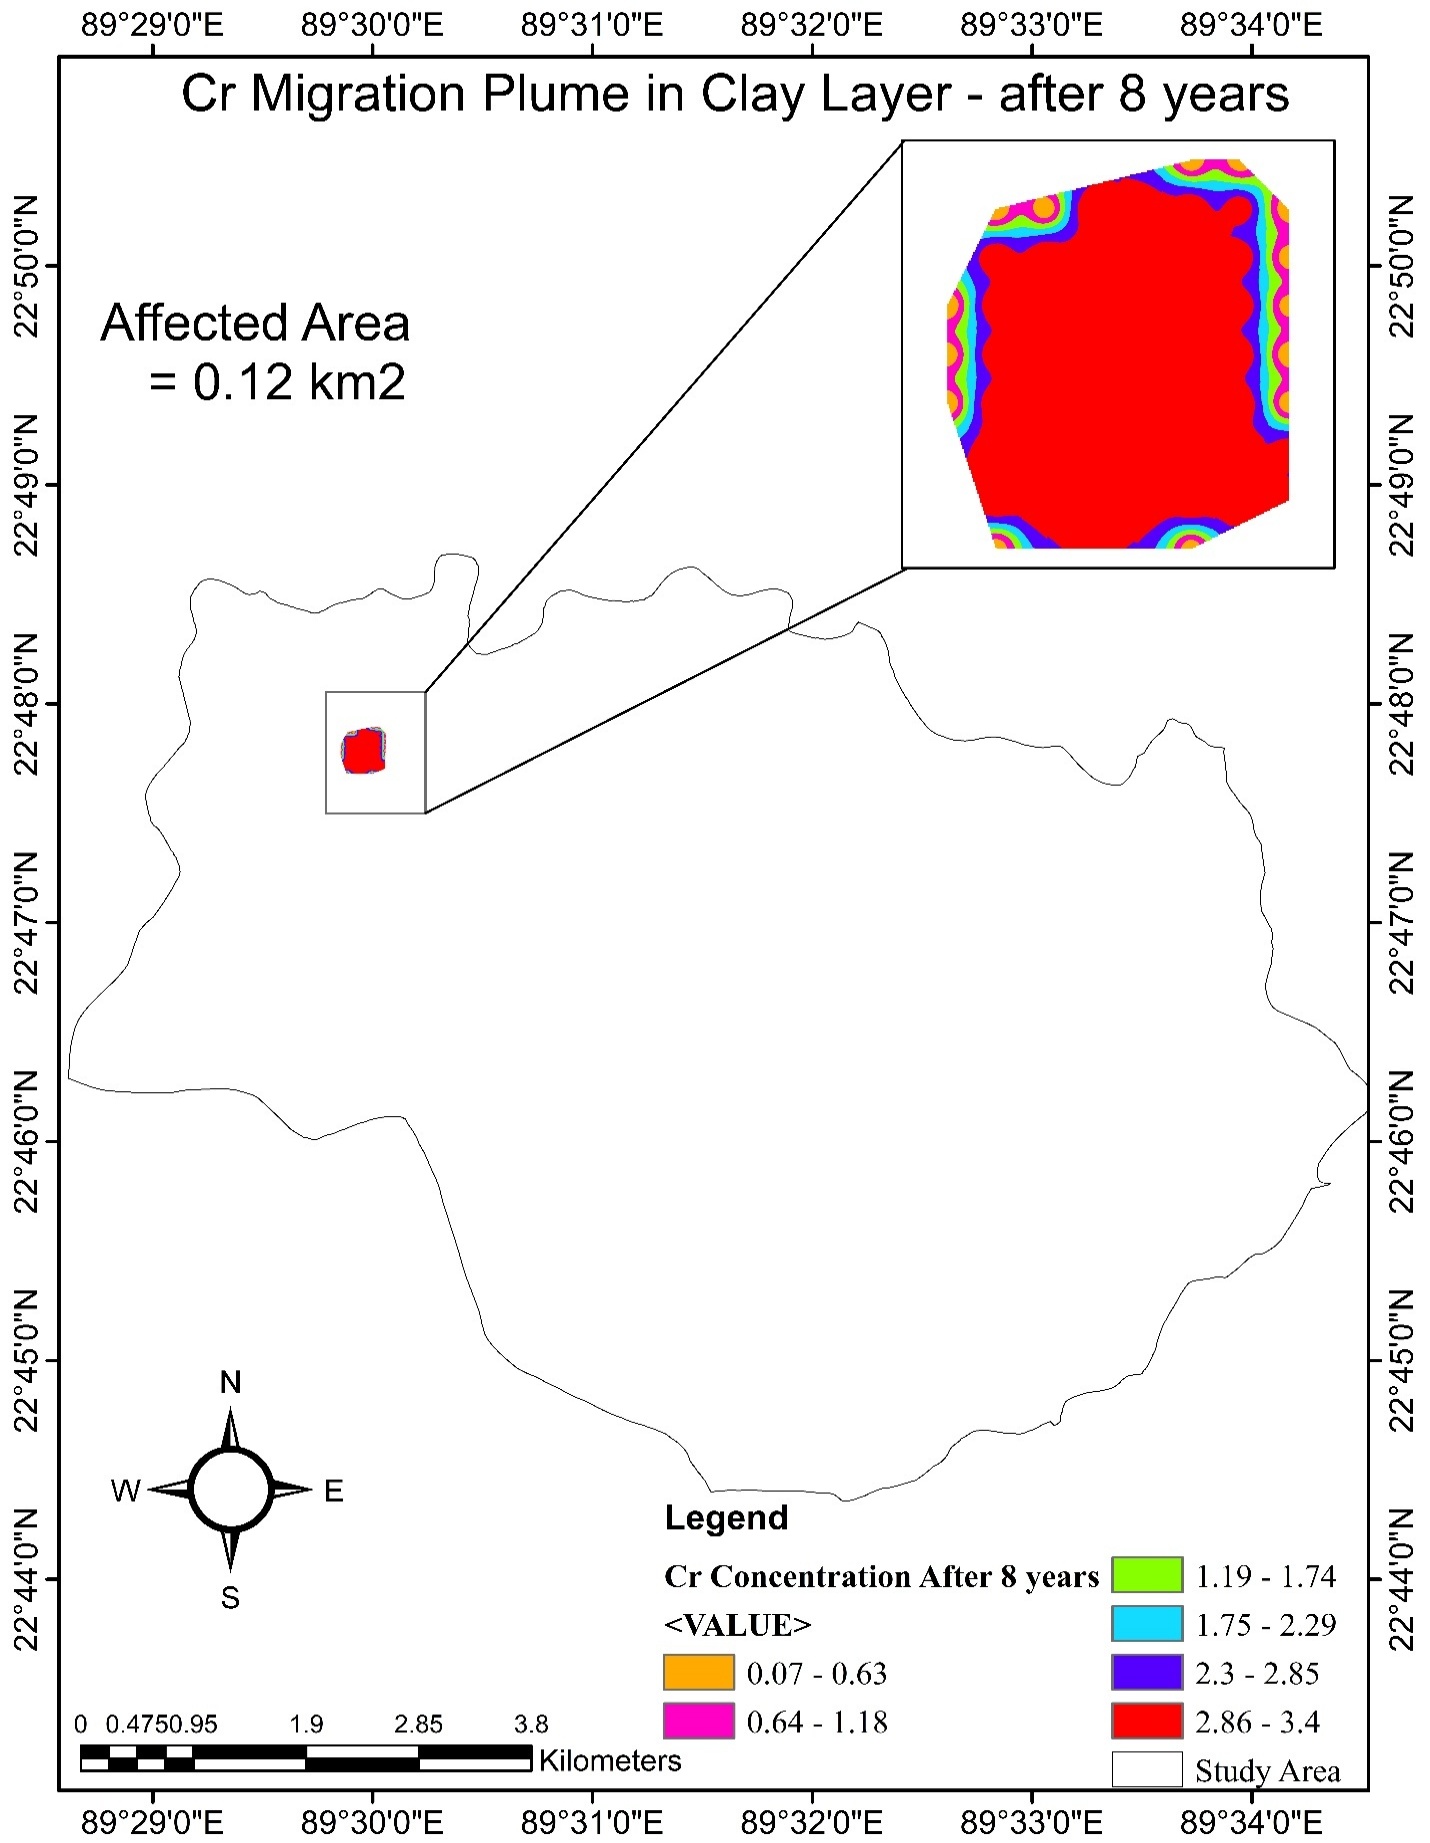
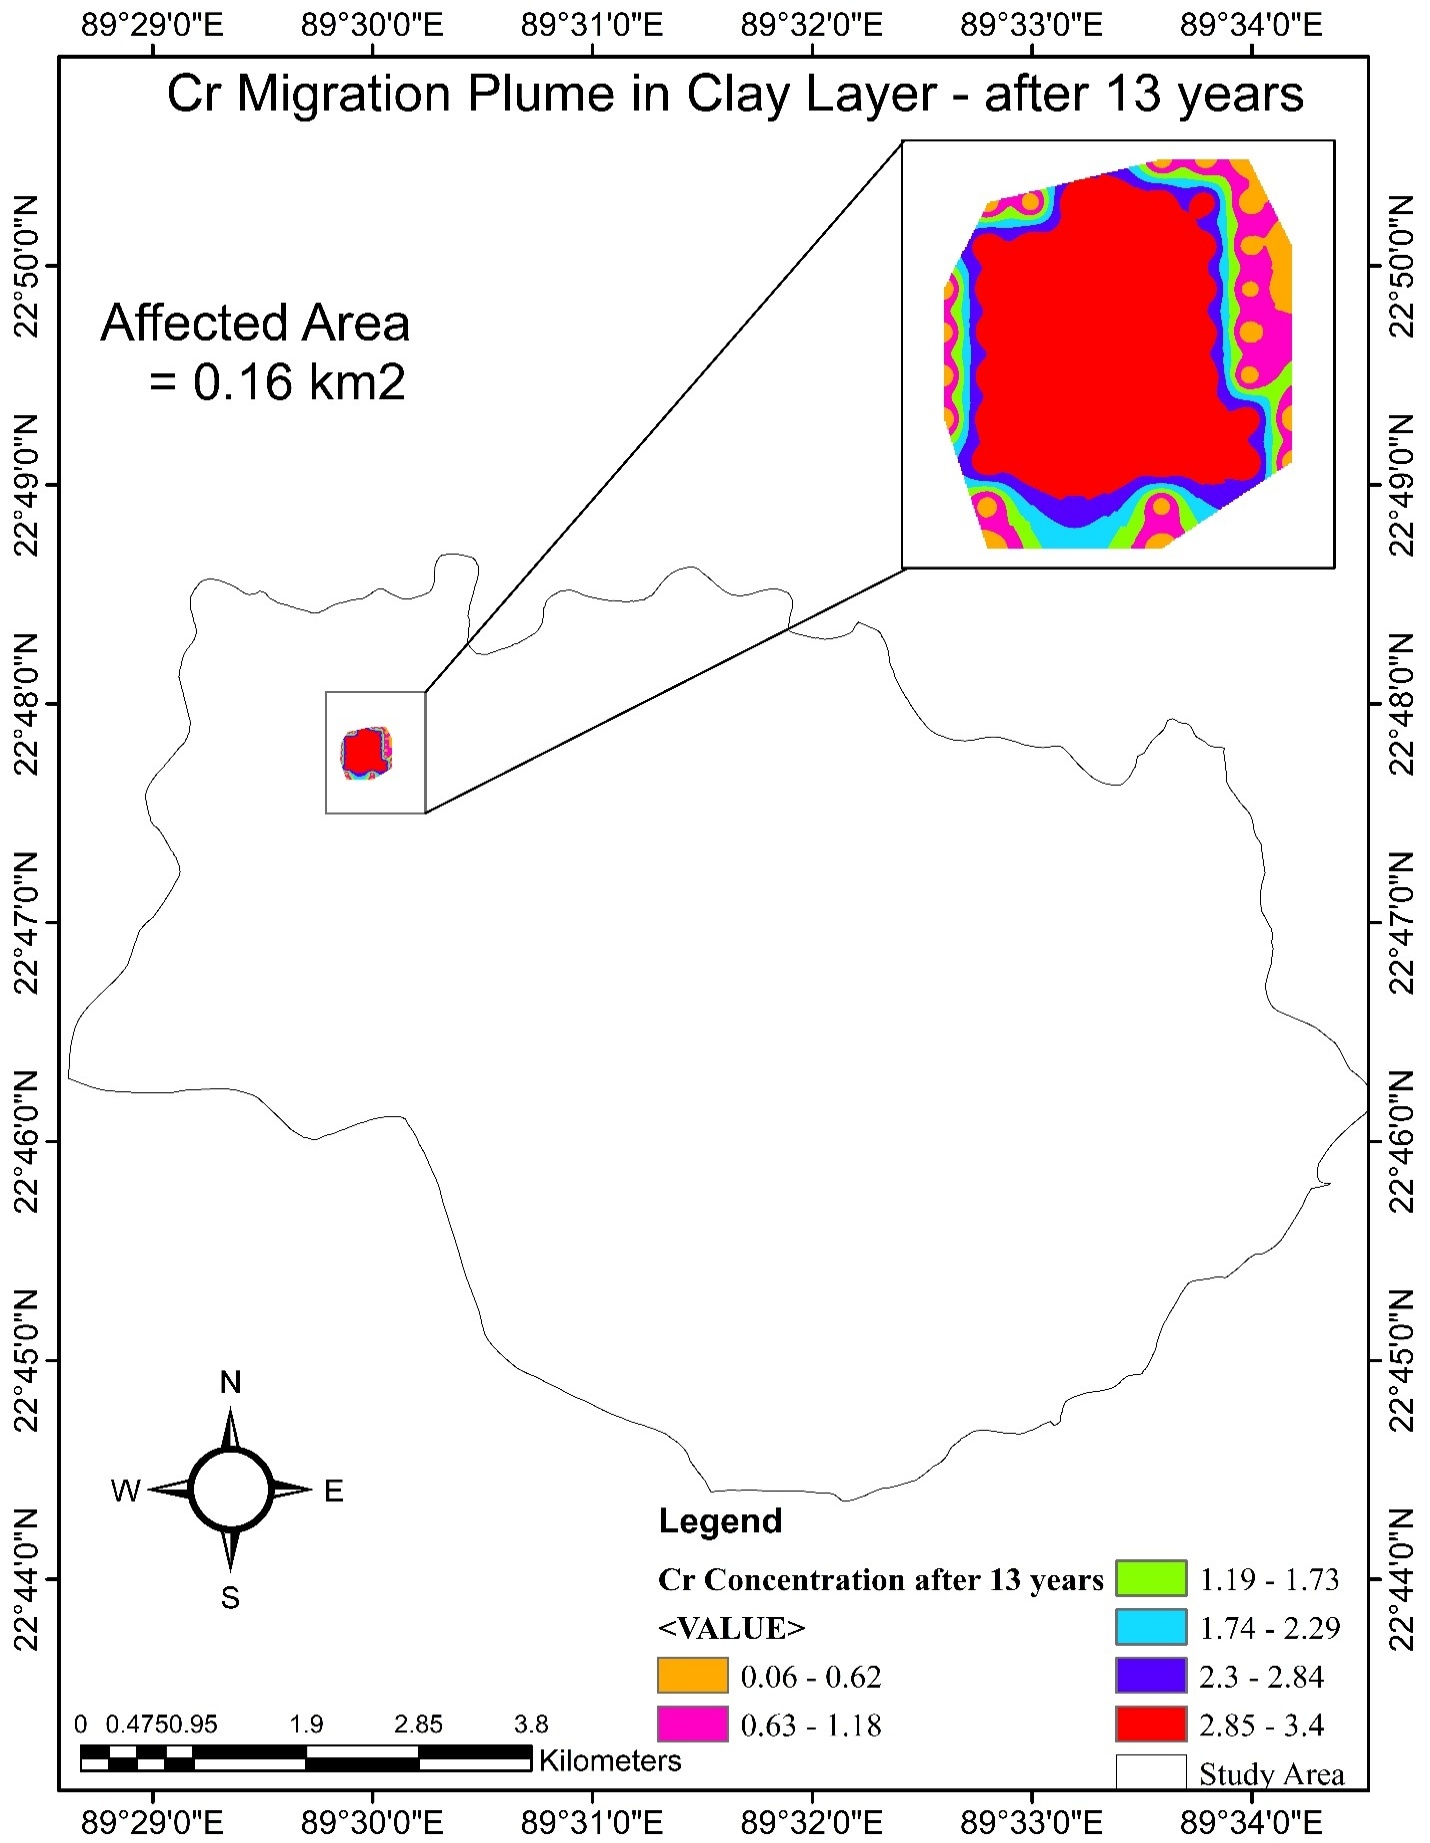
The study directly compared the affected areas in the upper clay layer and the first sand aquifer. Because the sand unit has much higher hydraulic conductivity, its modeled contamination footprint expands more rapidly and remains substantially larger through the simulation.
| Modeled time | Clay affected area (km²) | Sand affected area (km²) | Sand relative to clay |
|---|---|---|---|
| 1 year | 0.081 | 0.15 | 85% larger |
| 8 years | 0.12 | 0.32 | 167% larger |
| 13 years | 0.16 | 0.41 | 156% larger |
| 23 years | 0.24 | 0.55 | 129% larger |
| 33 years | 0.31 | 0.66 | 113% larger |
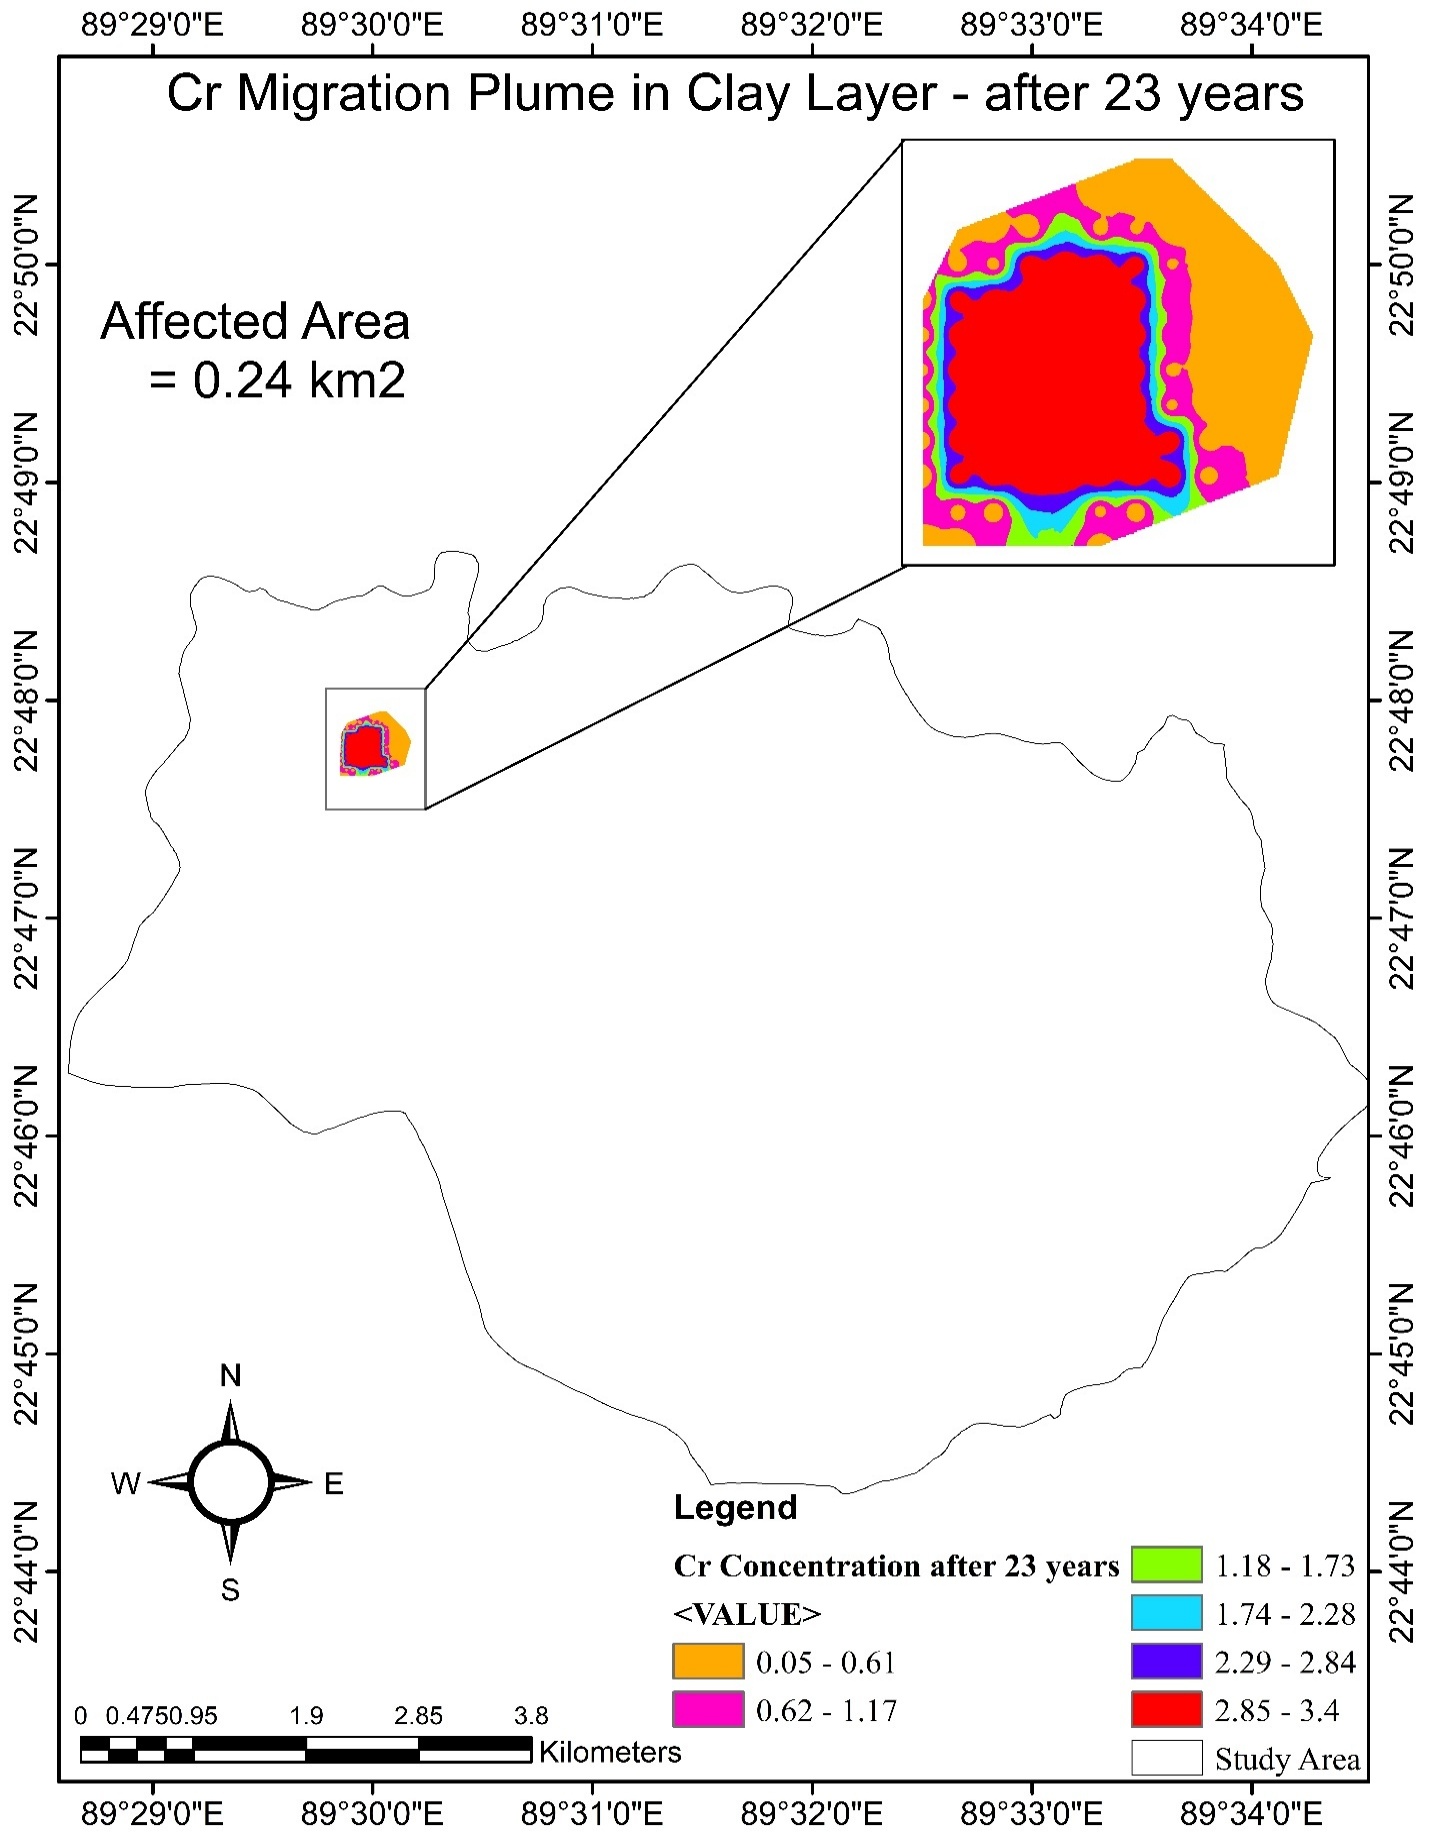
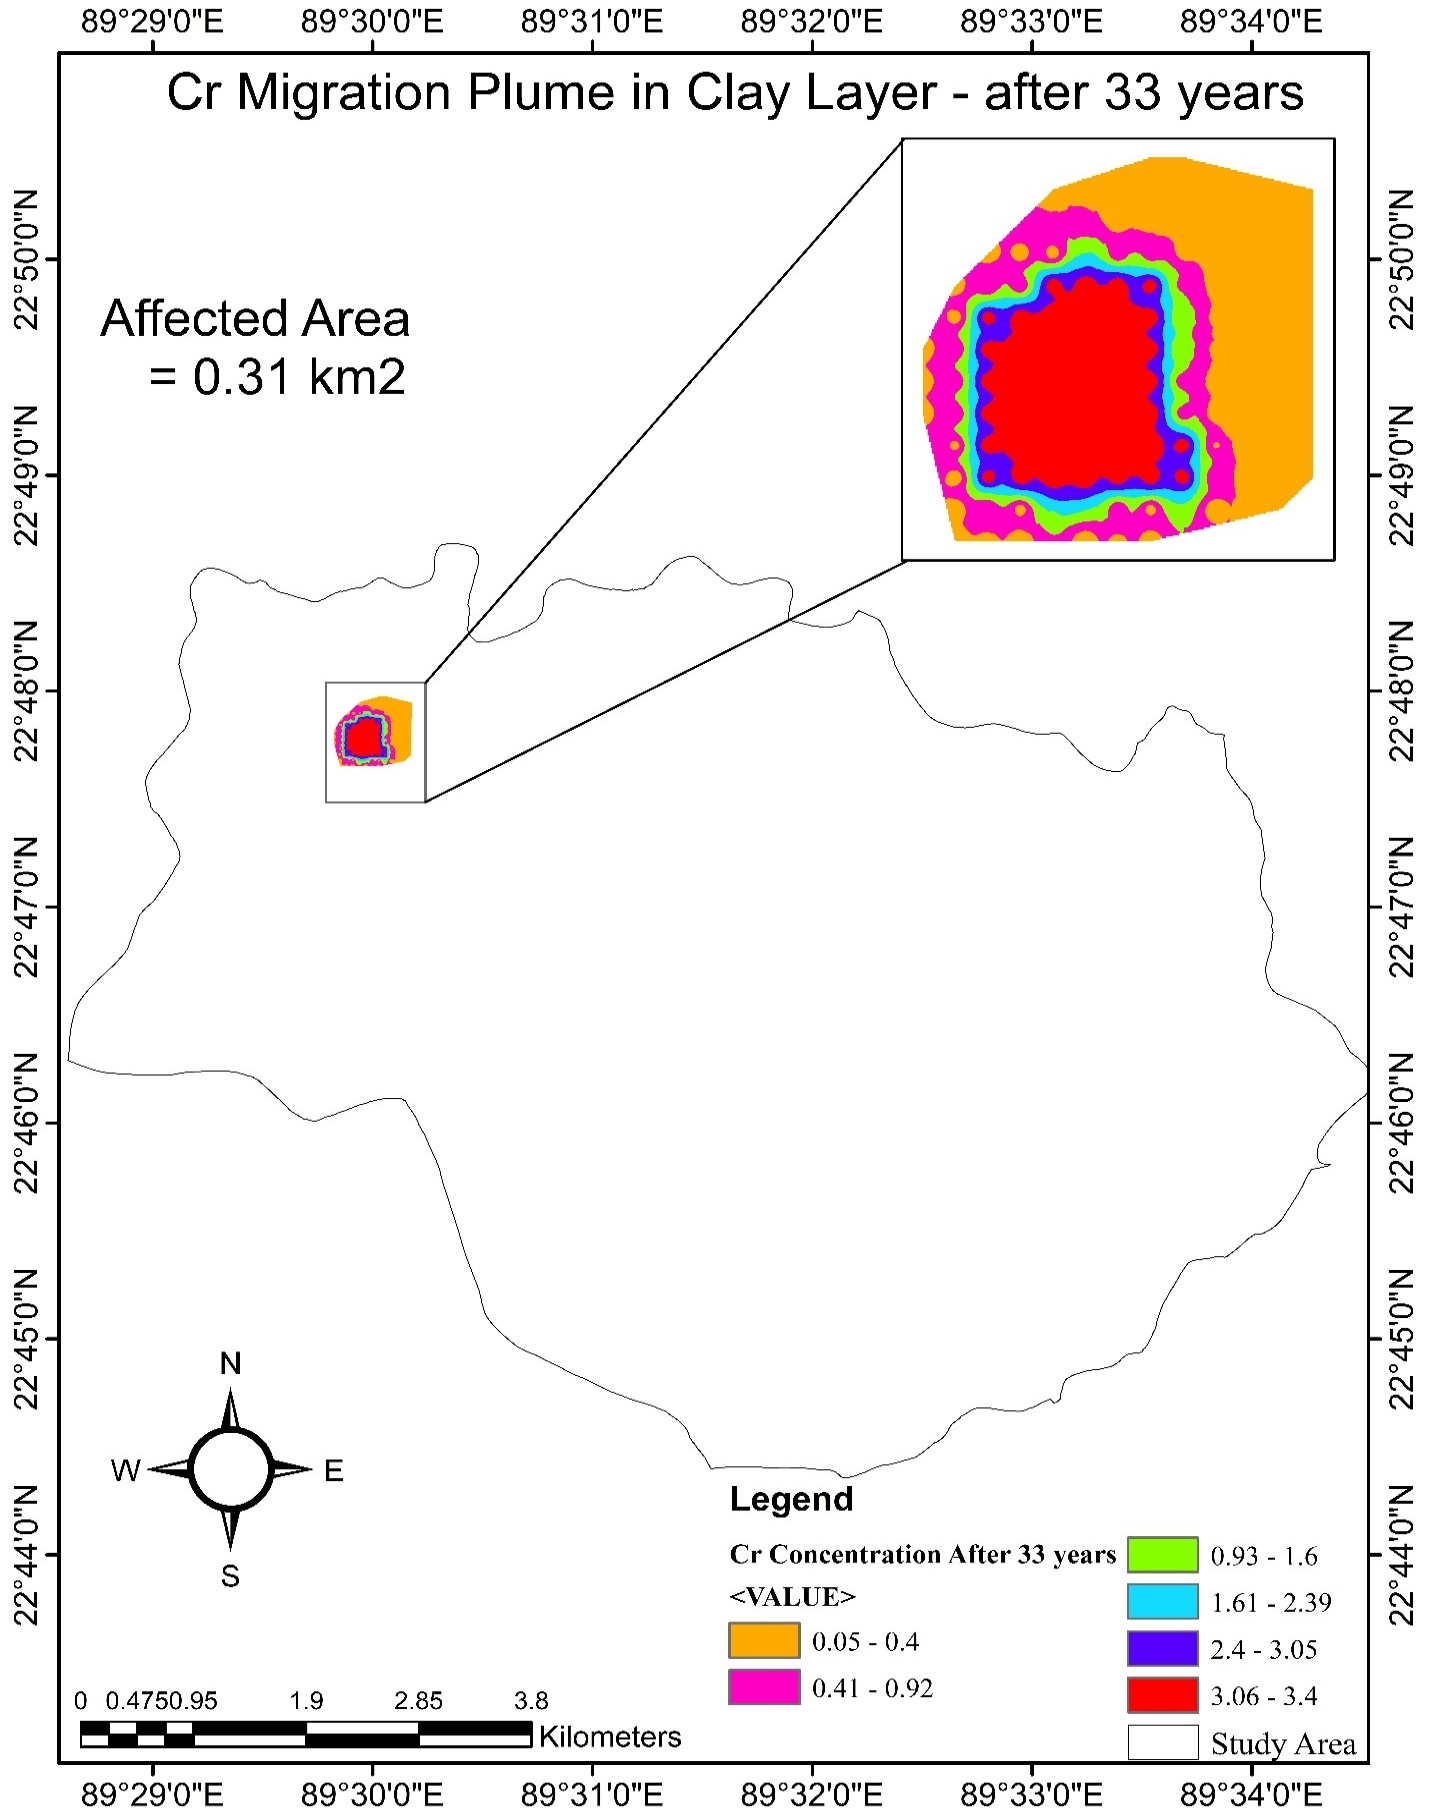
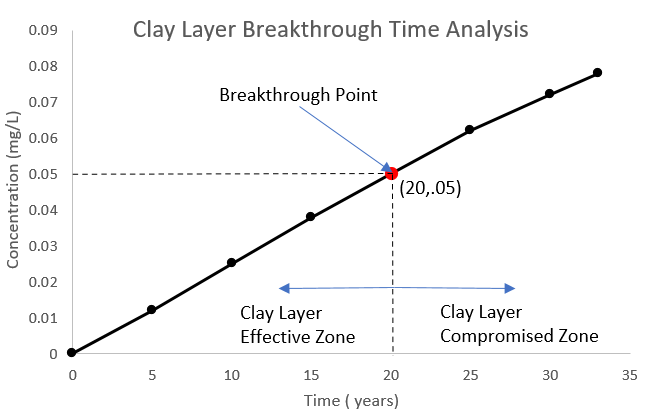
Modeled clay-layer breakthrough: approximately 20 years
The breakthrough analysis tracks when the selected chromium concentration threshold is reached in the underlying sand aquifer. Under the study assumptions, the model identifies a breakthrough time of approximately 20 years for the 0.05 mg/L threshold used in the study.
Long-term projection of affected area
The final published paper reports that the temporal expansion of the affected area is represented effectively by a second-order polynomial trend with R² = 0.9988. The final peer-reviewed formulation is reported here rather than an earlier projection explored during thesis development.
Limitations & what the model does not claim
The study is useful precisely because its constraints are explicit. The main limitations reported in the thesis and final paper include:
- Limited groundwater monitoring records and lack of a continuous time-series dataset.
- Concentration calibration based on a small number of observation wells.
- Insufficient monitoring information to calibrate groundwater-flow velocity as robustly as desired.
- Uncertainty in model boundary conditions, recharge and evapotranspiration representation.
- Layer-wise hydraulic conductivity, specific yield and specific storage were represented, while some other properties were simplified.
- No explicit geochemical reactions or reactive-transport processes were included.
Accordingly, the results are best interpreted as a calibrated physical transport framework and a baseline for improved monitoring and future reactive/uncertainty modeling—not as a complete geochemical description of chromium fate.
My contribution & research significance
The published author-contribution statement credits me with conceptualization, methodology, software modeling, data curation, and writing the original draft, with the work supervised and reviewed by Professor Md. Saiful Islam.
For me, the main value of this study is methodological: it required moving from an environmental question to a hydrostratigraphic conceptual model, translating that conceptualization into a numerical grid, coupling groundwater flow with solute transport, calibrating the simulation against field observations, analyzing spatial plume behavior, and carrying the work through peer review.